1019 - 108 Peter St
Listing History
Unit Highlights
Utilities Included
Utility Type
- Air Conditioning
- Central Air
- Heat Source
- Gas
- Heating
- Forced Air
Room Dimensions
About this Listing
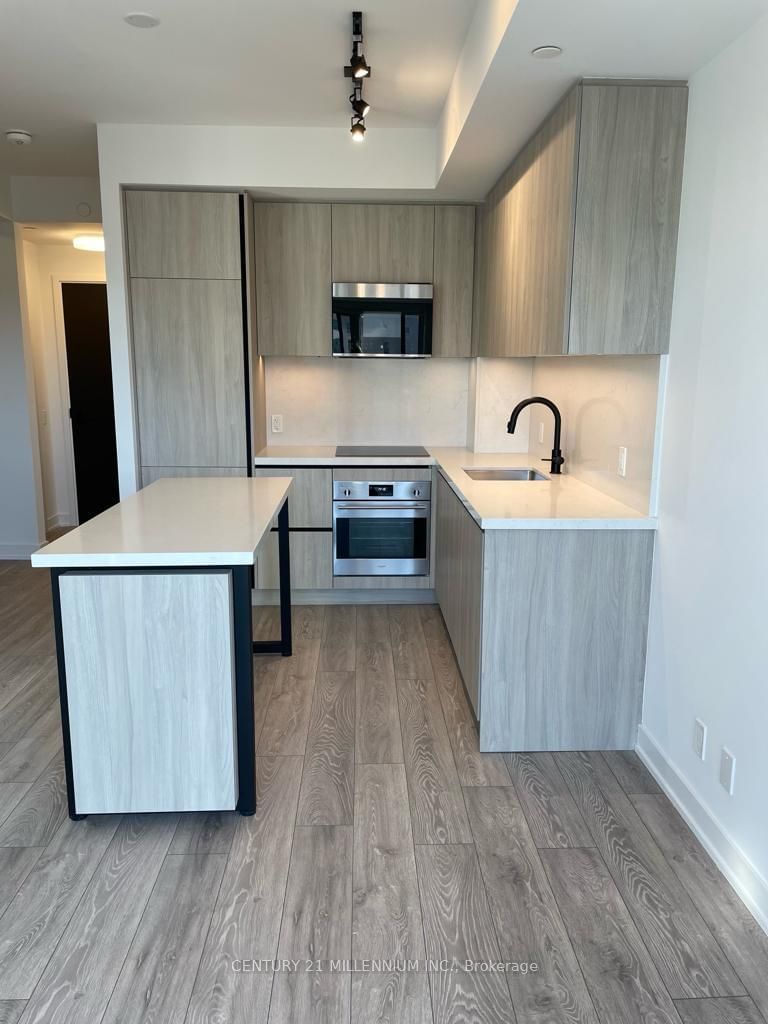
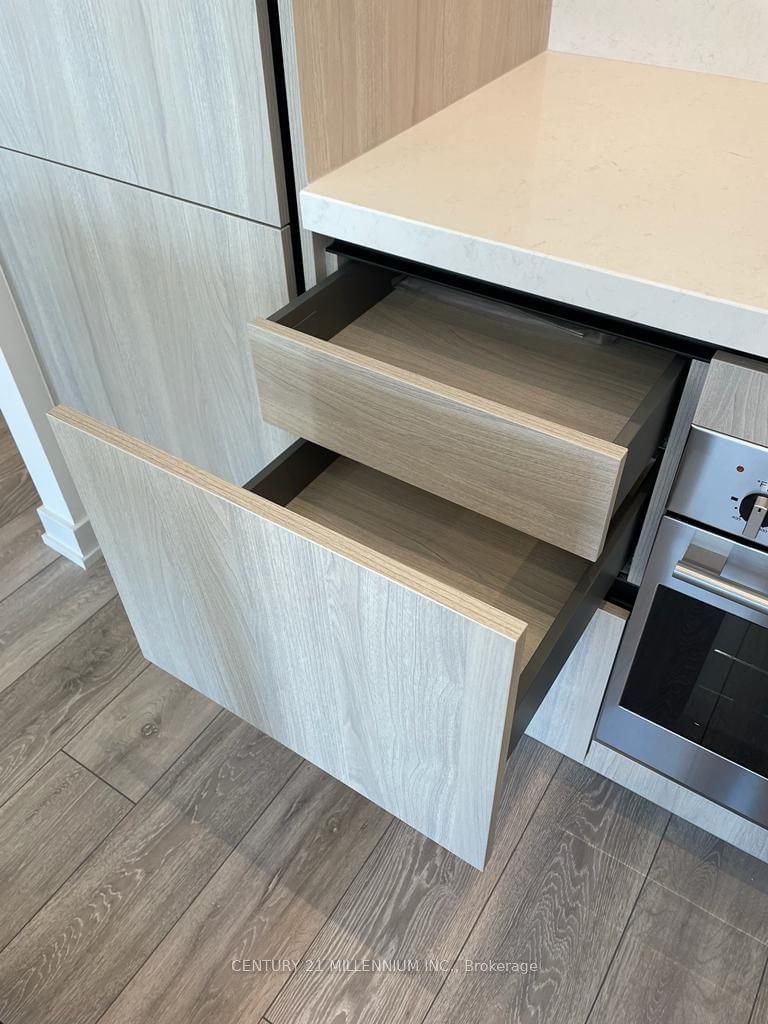
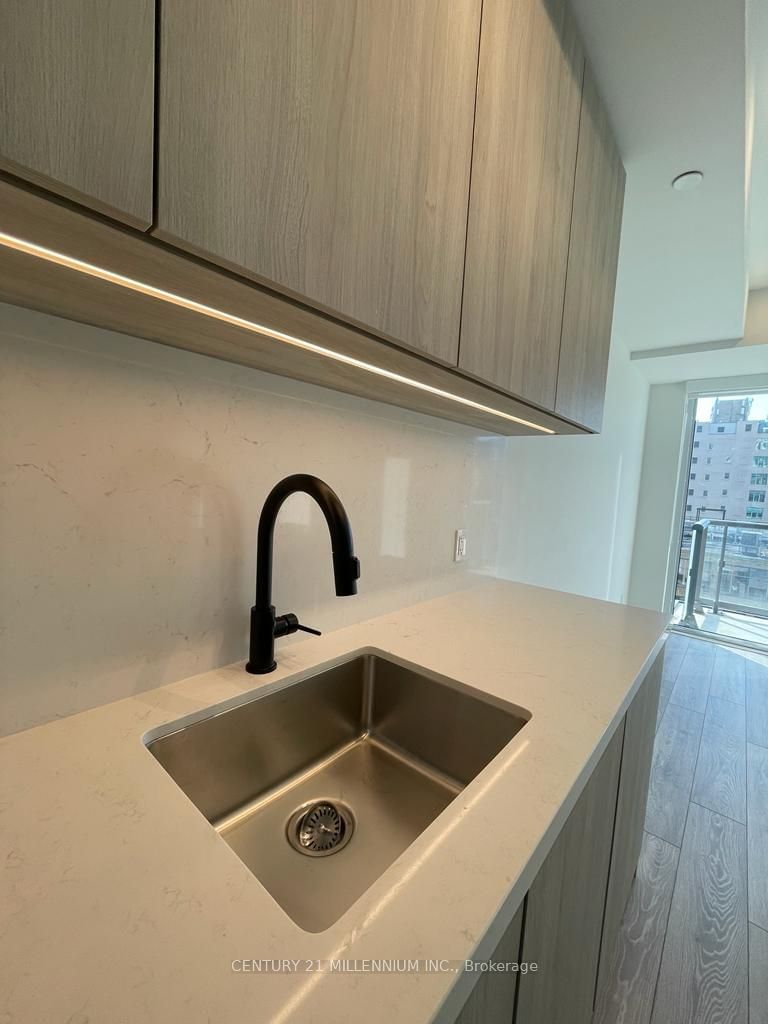
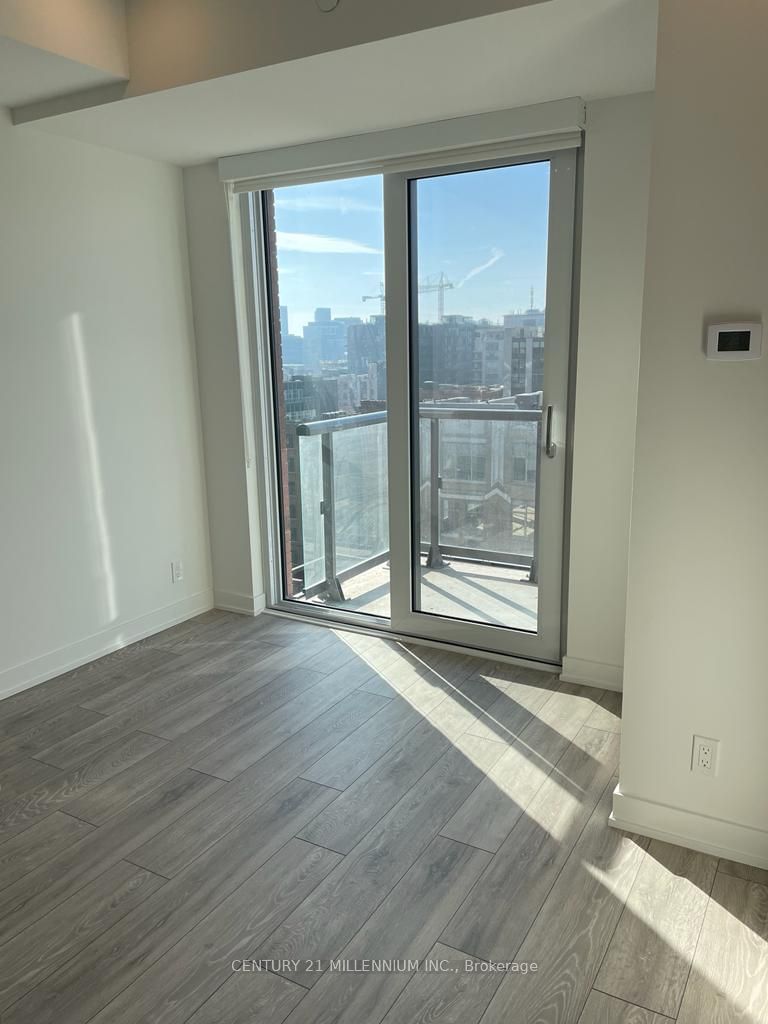
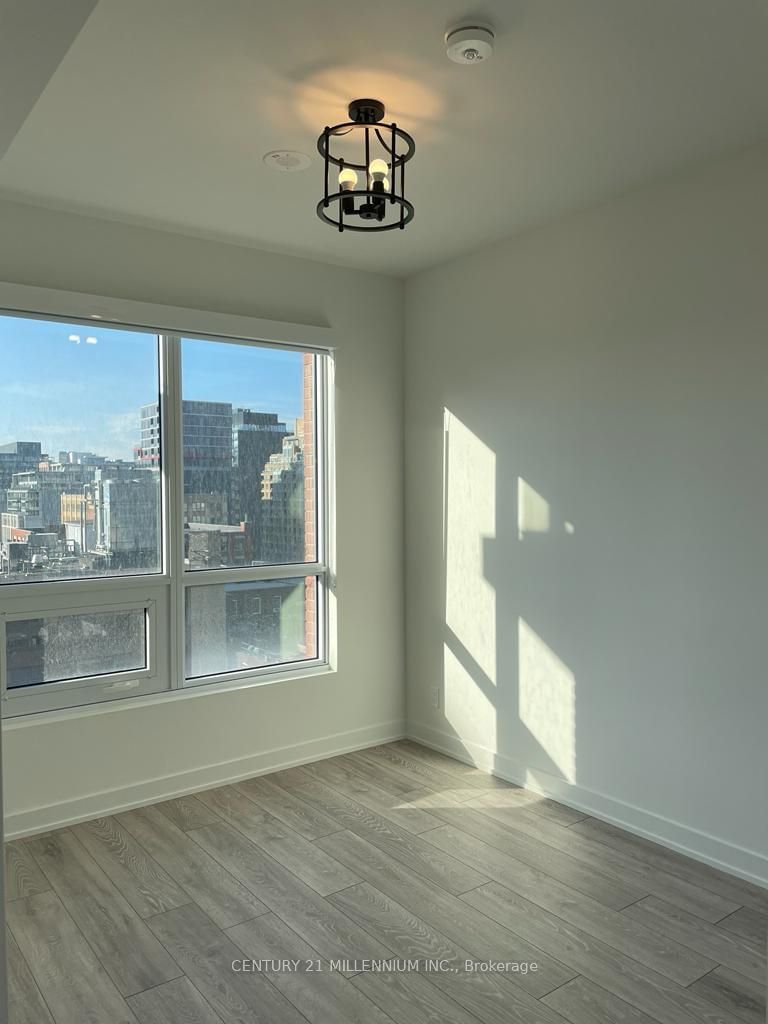
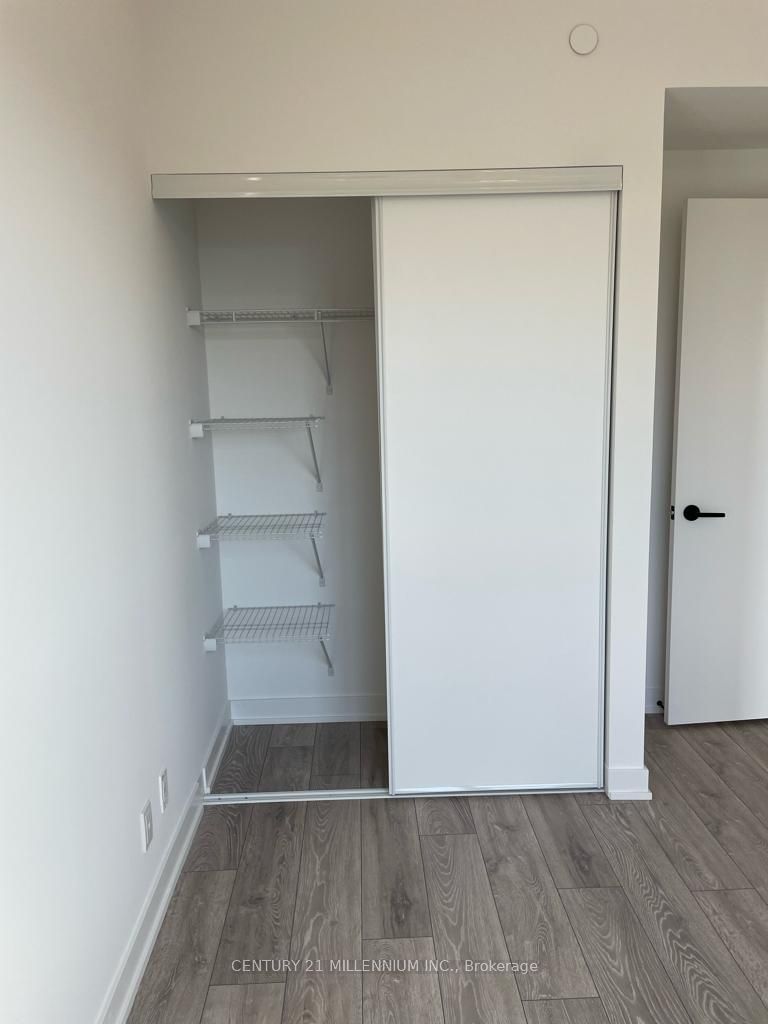
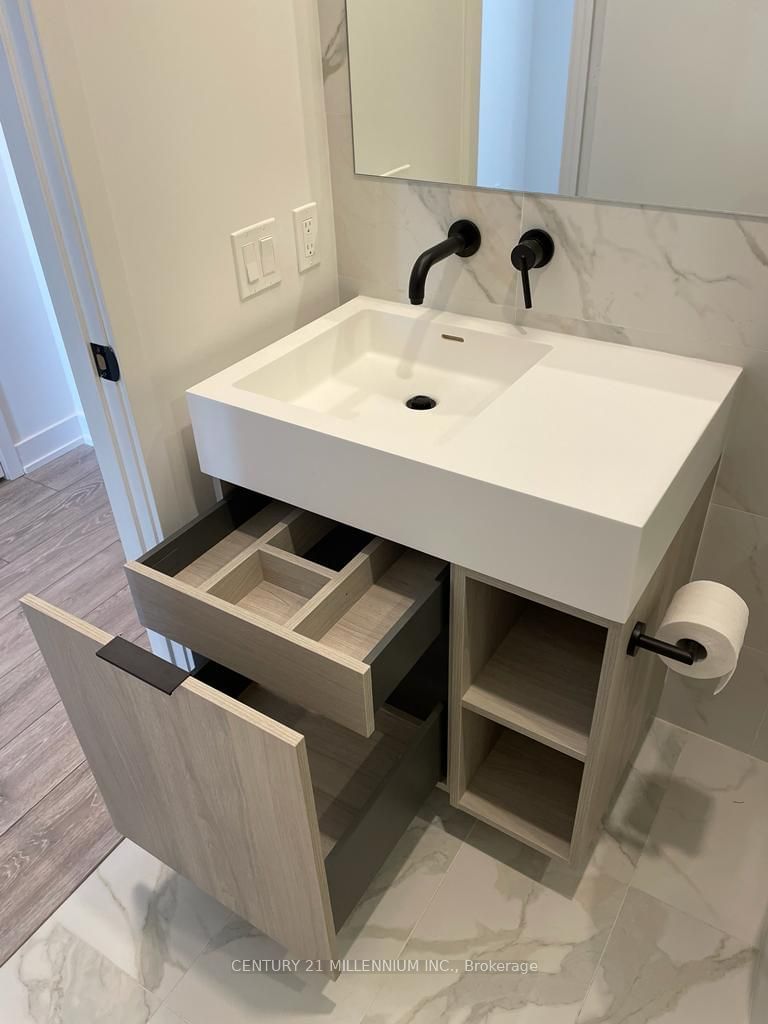
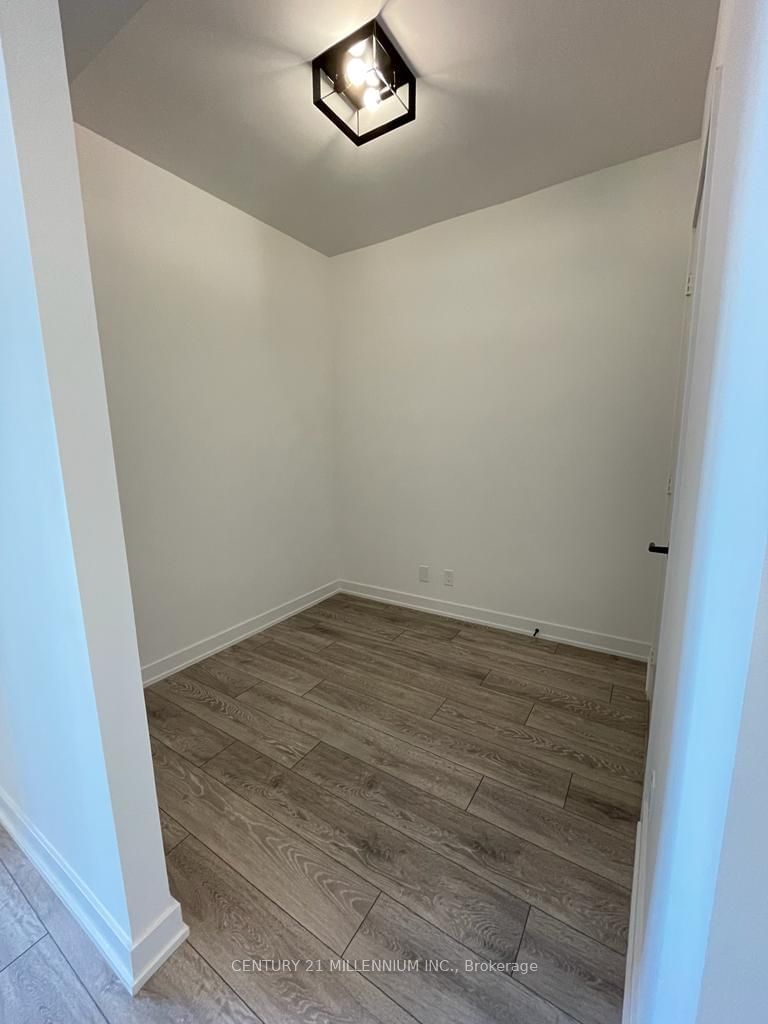
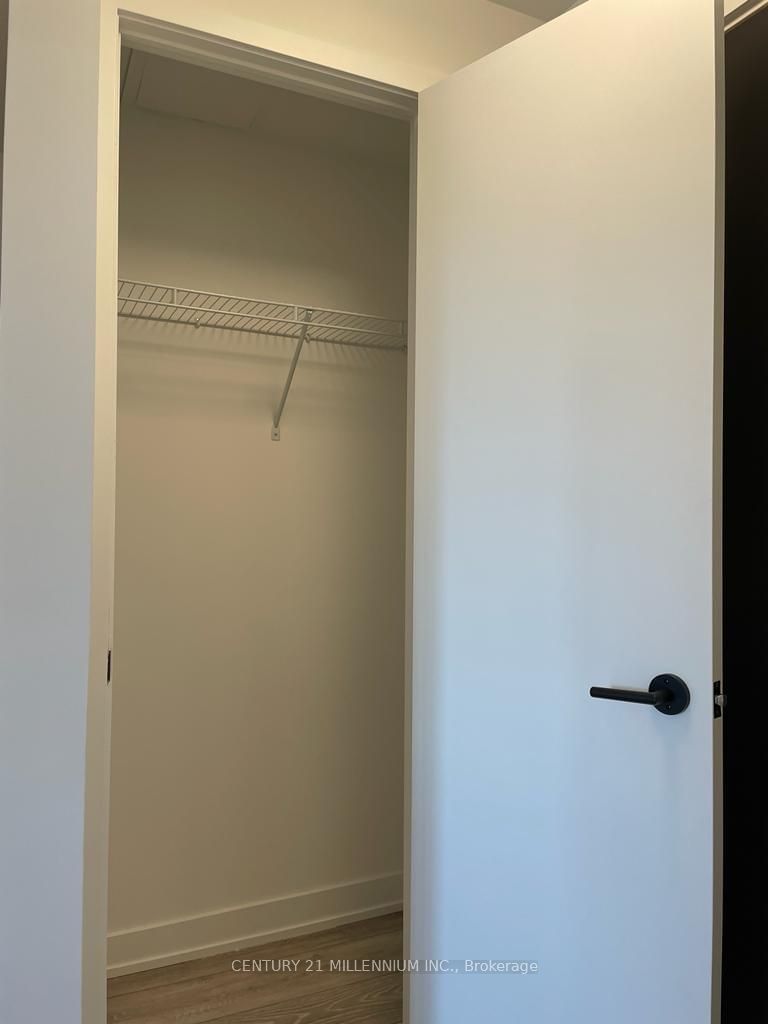
Discover the epitome of modern living in this pristine, only 1 year old condo. Boasting one bedroom plus a versatile den. Indulge in upgraded elegance with chic stone countertops and top-tier stainless steel appliances, including a B/I Fridge, B/I S/S Oven, B/I Range Top, B/I Dishwasher, B/I over the Range S/S Microwave, and convenient in-suite front loading laundry. The fully upgraded bathroom adds a touch of luxury, while the den offers flexibility as an office, storage space, or even a cozy extra bedroom. Enjoy the walkout to your own private Balcony with breathtaking views of the City. Located at the coveted intersection of Peter St and Richmond St W, this residence is a harmonious blend of style and functionality.
ExtrasTenant to pay all Utilities and carry Tenant Insurance.
century 21 millennium inc.MLS® #C9511512
Amenities
Explore Neighbourhood
Similar Listings
Demographics
Based on the dissemination area as defined by Statistics Canada. A dissemination area contains, on average, approximately 200 – 400 households.
Price Trends
Maintenance Fees
Building Trends At Peter & Adelaide Condos
Days on Strata
List vs Selling Price
Offer Competition
Turnover of Units
Property Value
Price Ranking
Sold Units
Rented Units
Best Value Rank
Appreciation Rank
Rental Yield
High Demand
Transaction Insights at 350 Adelaide Street W
| Studio | 1 Bed | 1 Bed + Den | 2 Bed | 2 Bed + Den | 3 Bed | 3 Bed + Den | |
|---|---|---|---|---|---|---|---|
| Price Range | No Data | $485,000 - $635,000 | $590,000 - $770,000 | $720,000 - $1,070,000 | $893,000 | $875,000 - $1,340,000 | No Data |
| Avg. Cost Per Sqft | No Data | $1,250 | $1,221 | $1,168 | $1,298 | $1,192 | No Data |
| Price Range | No Data | $1,500 - $2,700 | $2,250 - $3,200 | $1,380 - $3,500 | $2,950 - $3,700 | $1,350 - $5,450 | No Data |
| Avg. Wait for Unit Availability | No Data | 46 Days | 34 Days | 45 Days | No Data | 87 Days | No Data |
| Avg. Wait for Unit Availability | 22 Days | 5 Days | 3 Days | 3 Days | 11 Days | 10 Days | No Data |
| Ratio of Units in Building | 1% | 20% | 33% | 31% | 7% | 10% | 1% |
Transactions vs Inventory
Total number of units listed and leased in Queen West
