4209 - 108 Peter St


Listing History
Unit Highlights
Maintenance Fees
Utility Type
- Air Conditioning
- Central Air
- Heat Source
- Gas
- Heating
- Forced Air
Room Dimensions
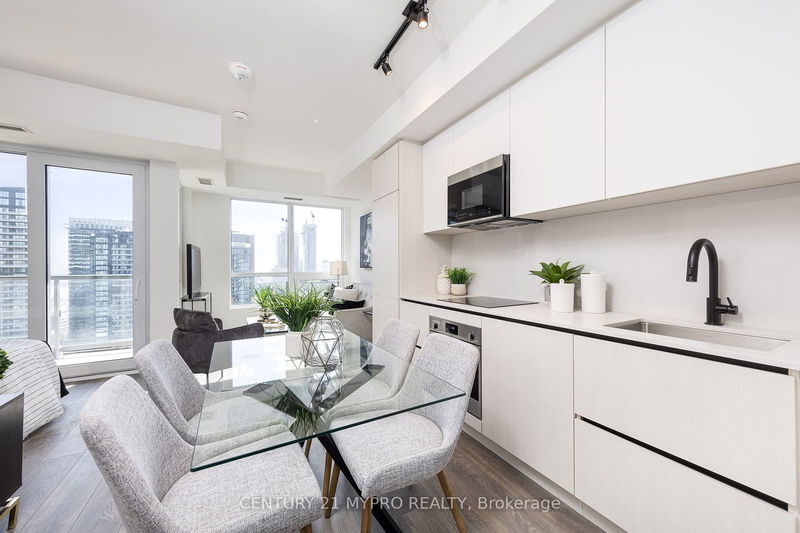
About this Listing
Experience unparalleled luxury living in the heart of the Entertainment District with the stunningPeter & Adelaide residence. This exceptional meticulously designed space featuring one open bedroom, one lavish bathroom, and a sleek designer kitchen with high-end integrated appliances. With 9-footceilings and elegant laminate flooring throughout, with an open balcony perfect for soaking in thecitys vibrant energy. Enjoy the convenience of living in one of the citys most coveted locations,where entertainment, dining, and cultural attractions are just steps away. Welcome to a lifestylethat seamlessly blends luxury and convenience in the heart of the city.
century 21 mypro realtyMLS® #C8468104
Amenities
Explore Neighbourhood
Similar Listings
Demographics
Based on the dissemination area as defined by Statistics Canada. A dissemination area contains, on average, approximately 200 – 400 households.
Price Trends
Maintenance Fees
Building Trends At Peter & Adelaide Condos
Days on Strata
List vs Selling Price
Offer Competition
Turnover of Units
Property Value
Price Ranking
Sold Units
Rented Units
Best Value Rank
Appreciation Rank
Rental Yield
High Demand
Transaction Insights at 350 Adelaide Street W
| Studio | 1 Bed | 1 Bed + Den | 2 Bed | 2 Bed + Den | 3 Bed | 3 Bed + Den | |
|---|---|---|---|---|---|---|---|
| Price Range | No Data | $595,000 - $635,000 | $590,000 - $770,000 | $720,000 - $1,070,000 | $893,000 | $1,340,000 | No Data |
| Avg. Cost Per Sqft | No Data | $1,248 | $1,189 | $1,168 | $1,298 | $1,206 | No Data |
| Price Range | $2,150 - $2,500 | $1,500 - $2,700 | $2,250 - $3,200 | $1,380 - $3,500 | $2,950 - $3,700 | $1,350 - $5,450 | No Data |
| Avg. Wait for Unit Availability | No Data | 75 Days | 18 Days | 45 Days | No Data | No Data | No Data |
| Avg. Wait for Unit Availability | 22 Days | 5 Days | 3 Days | 3 Days | 12 Days | 9 Days | No Data |
| Ratio of Units in Building | 1% | 20% | 33% | 31% | 7% | 10% | 1% |
Transactions vs Inventory
Total number of units listed and sold in Queen West
