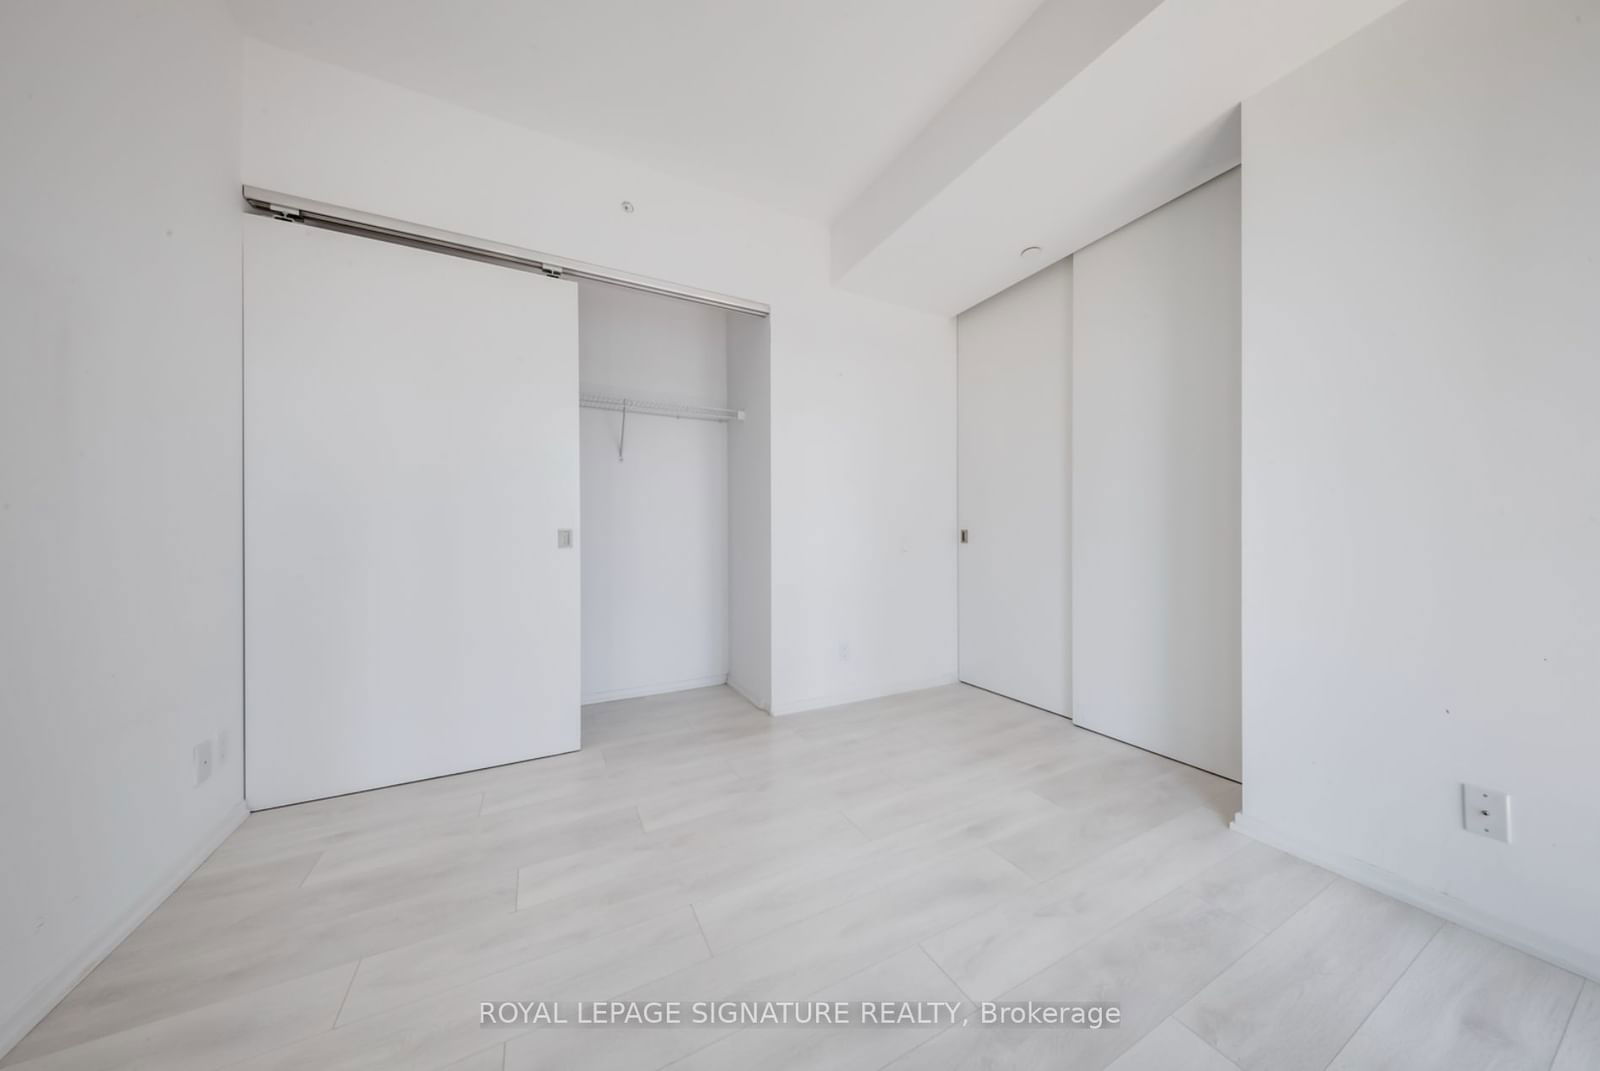
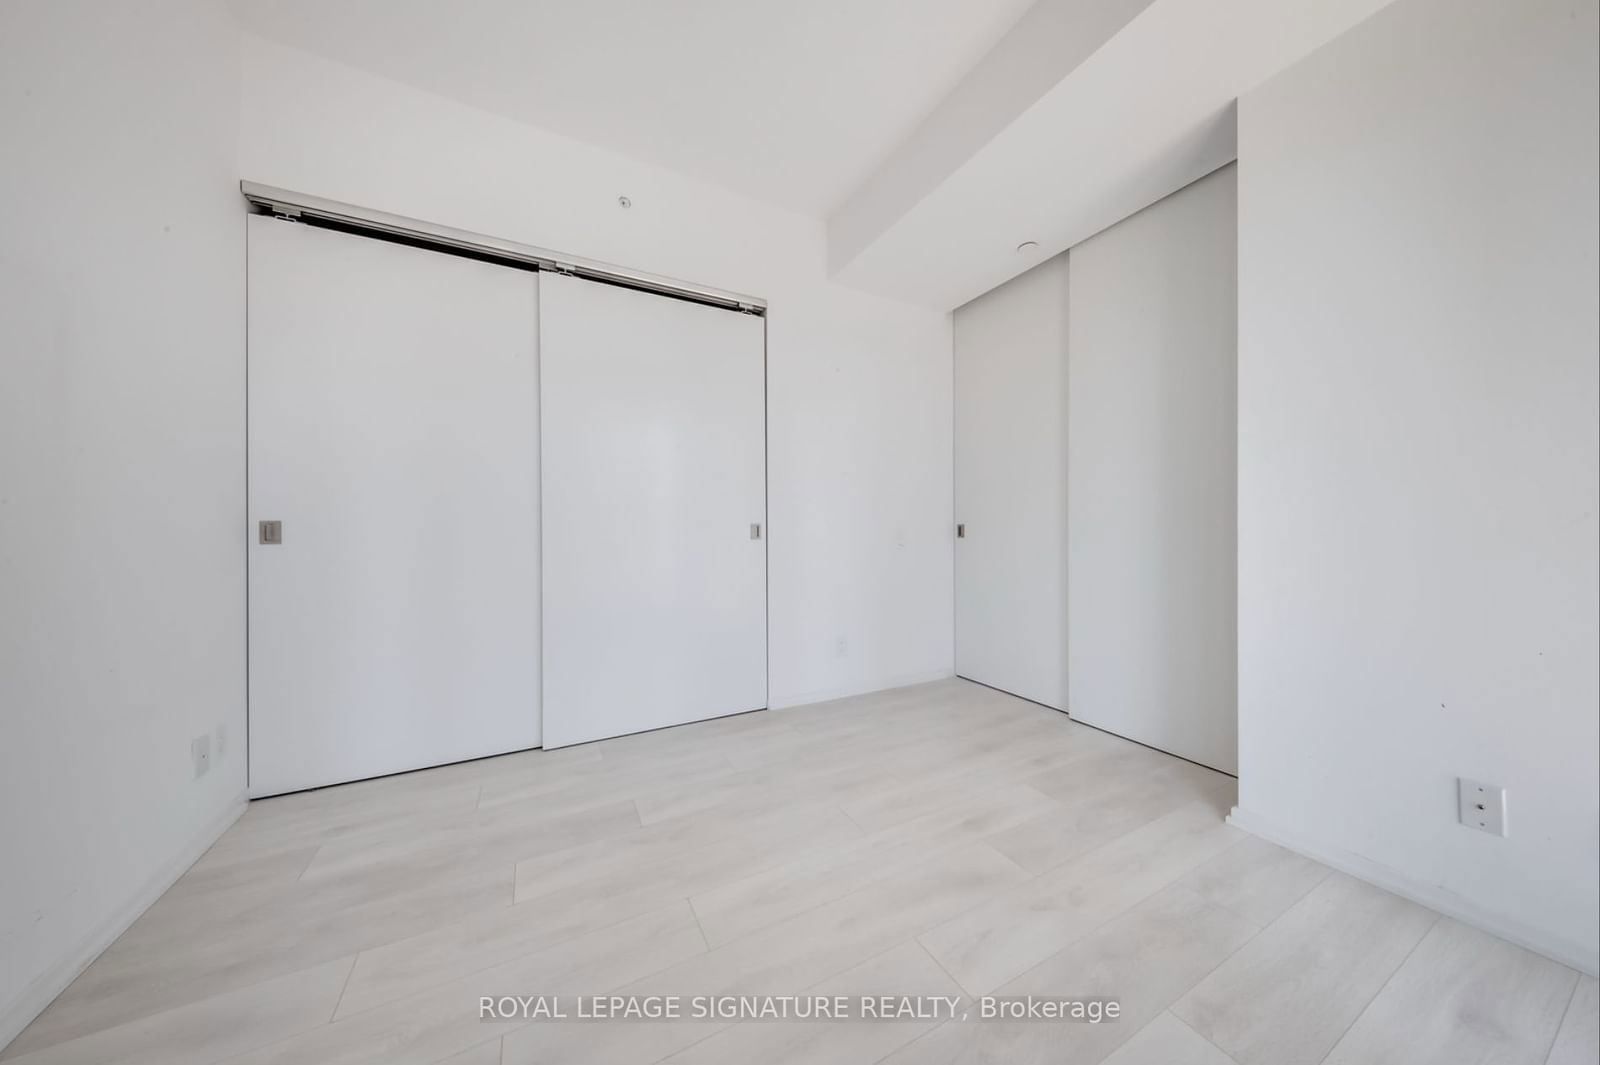
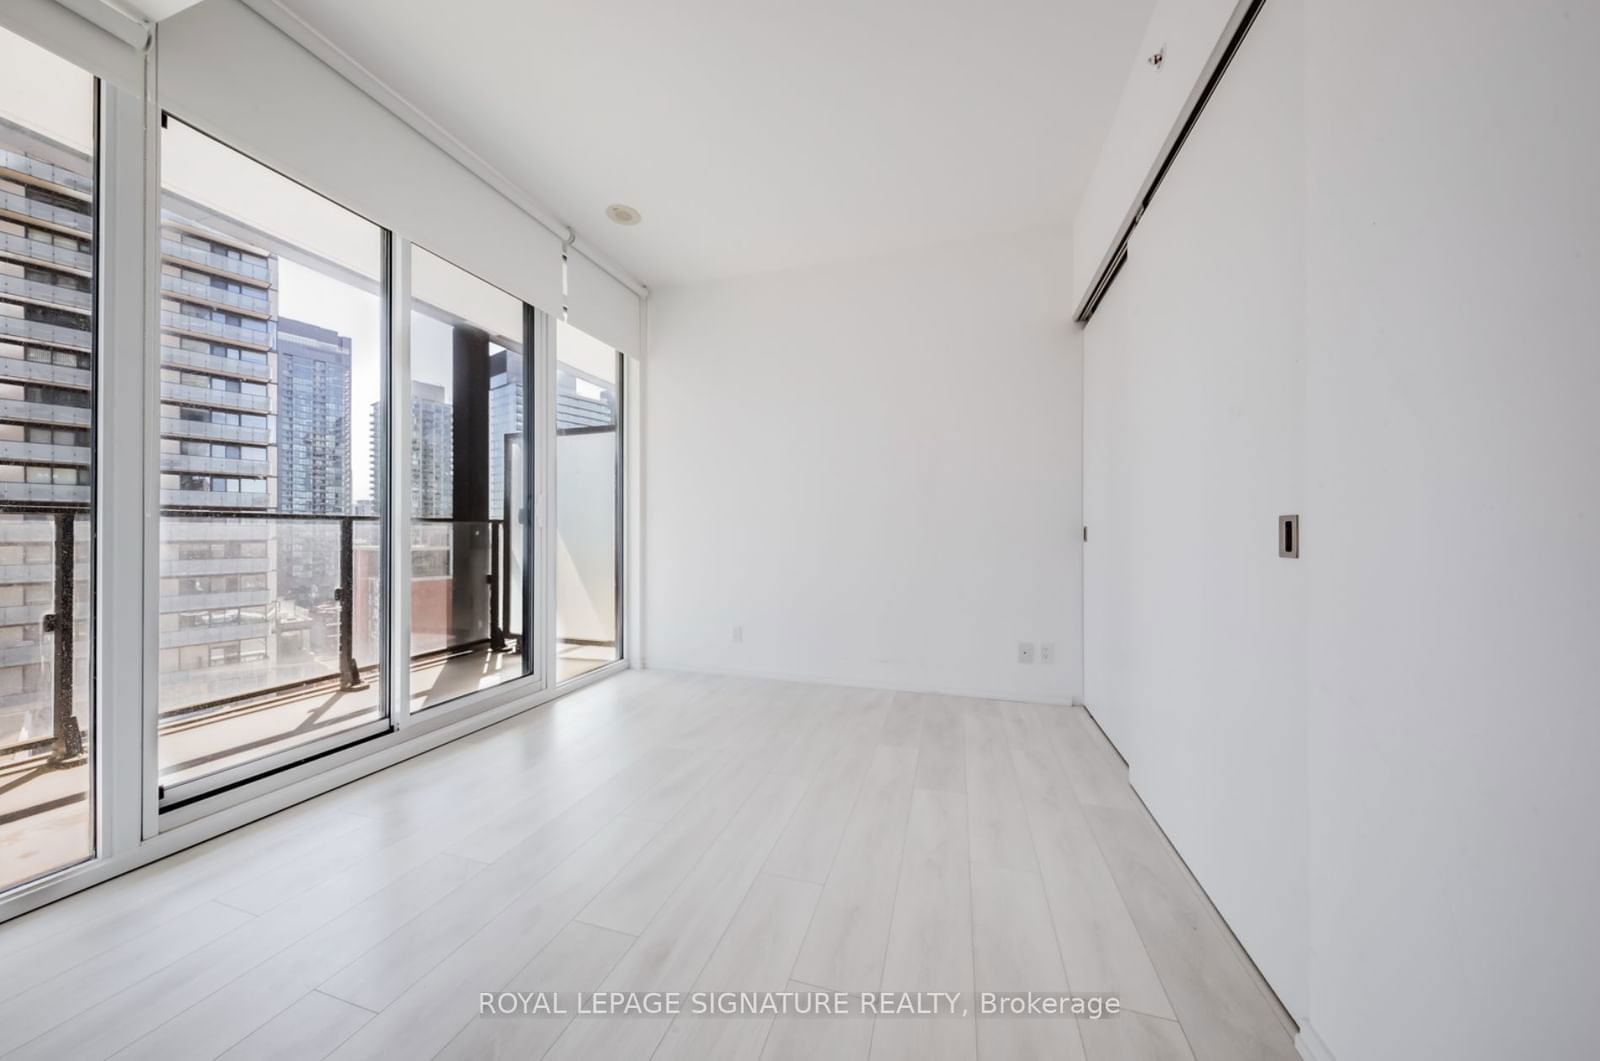
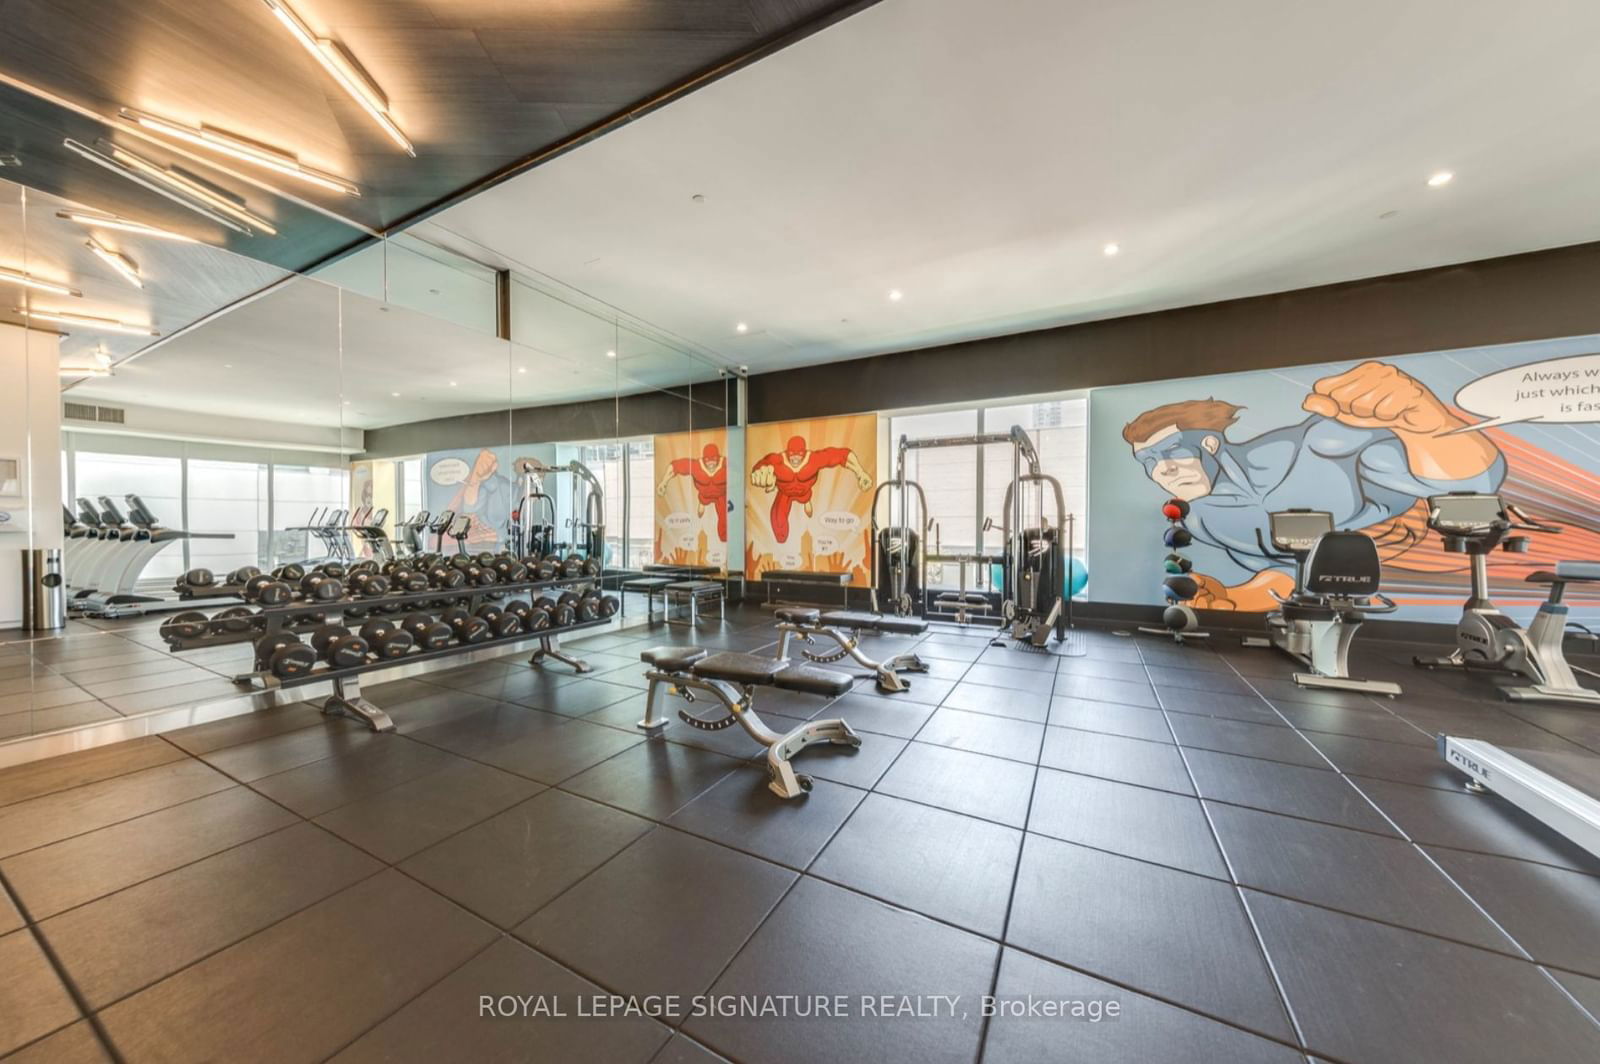
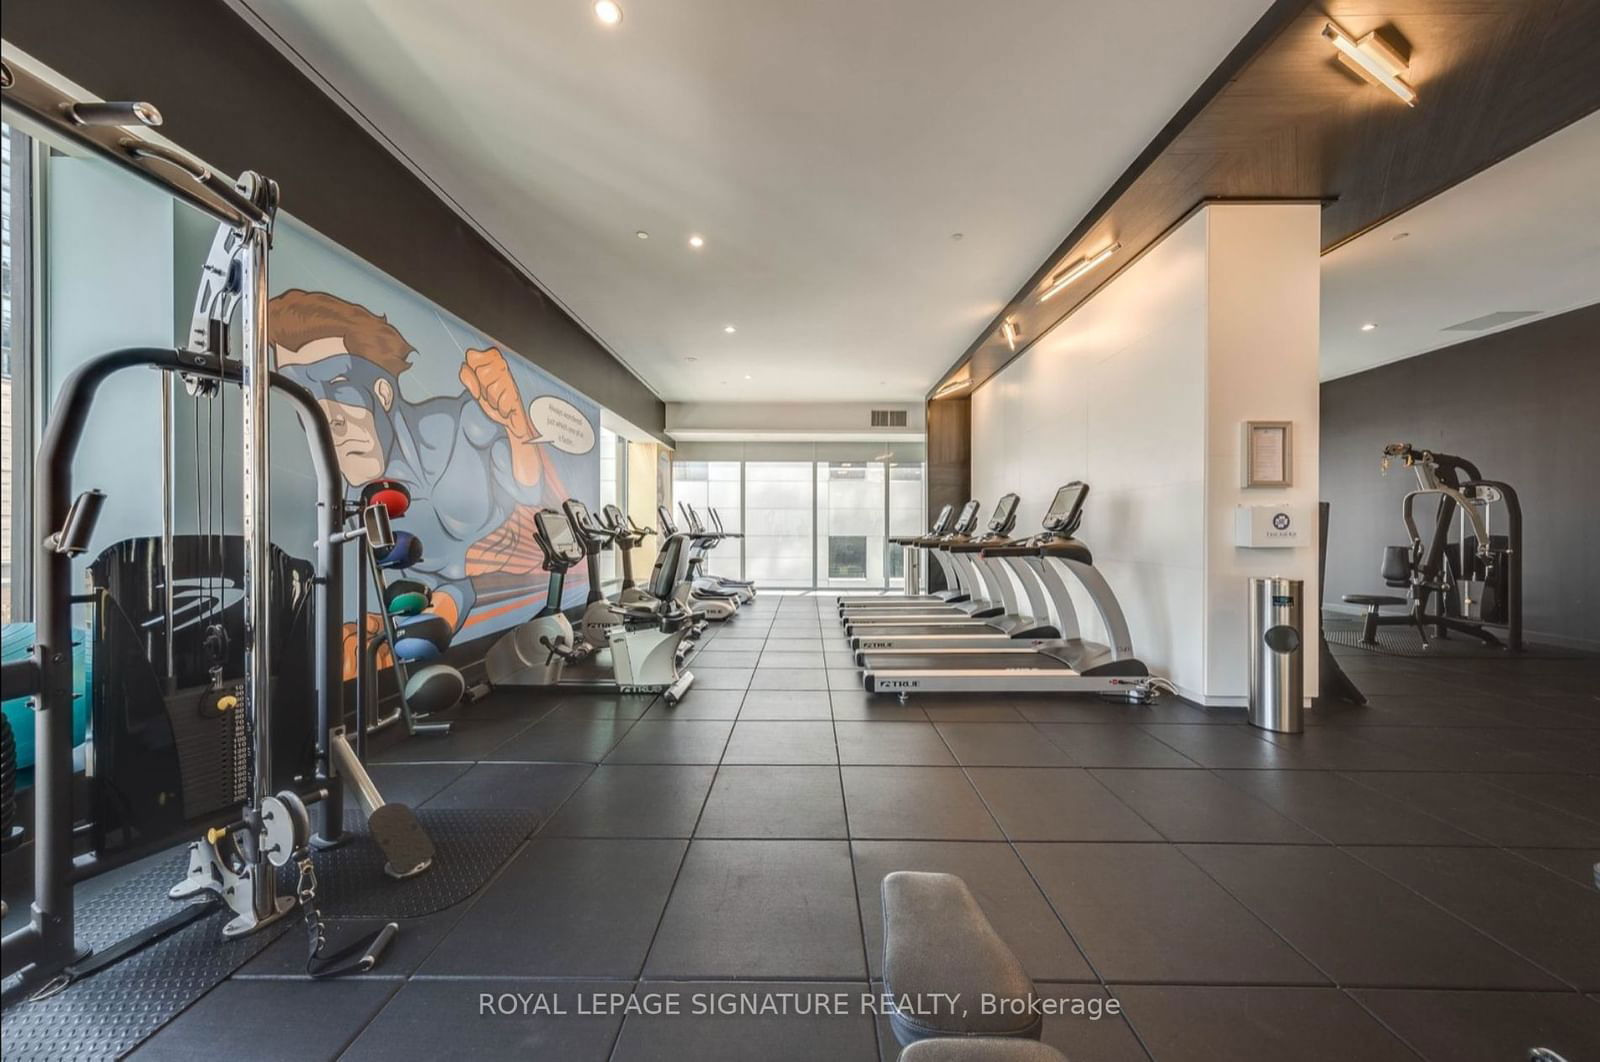
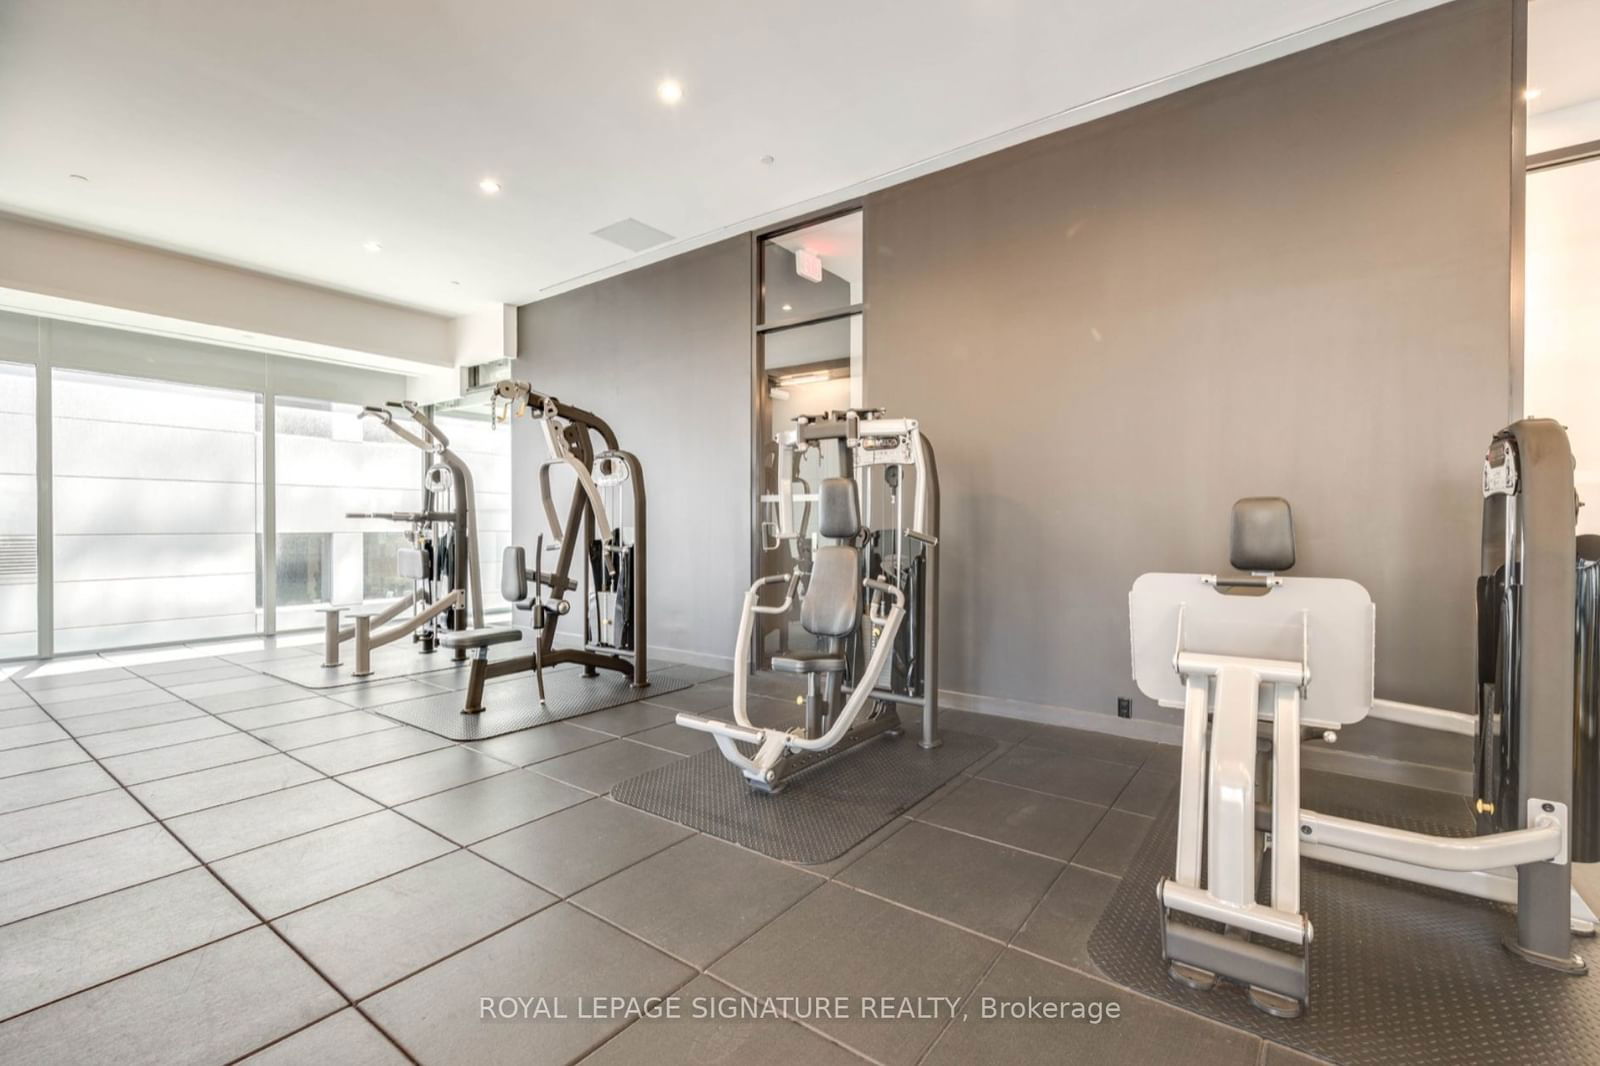
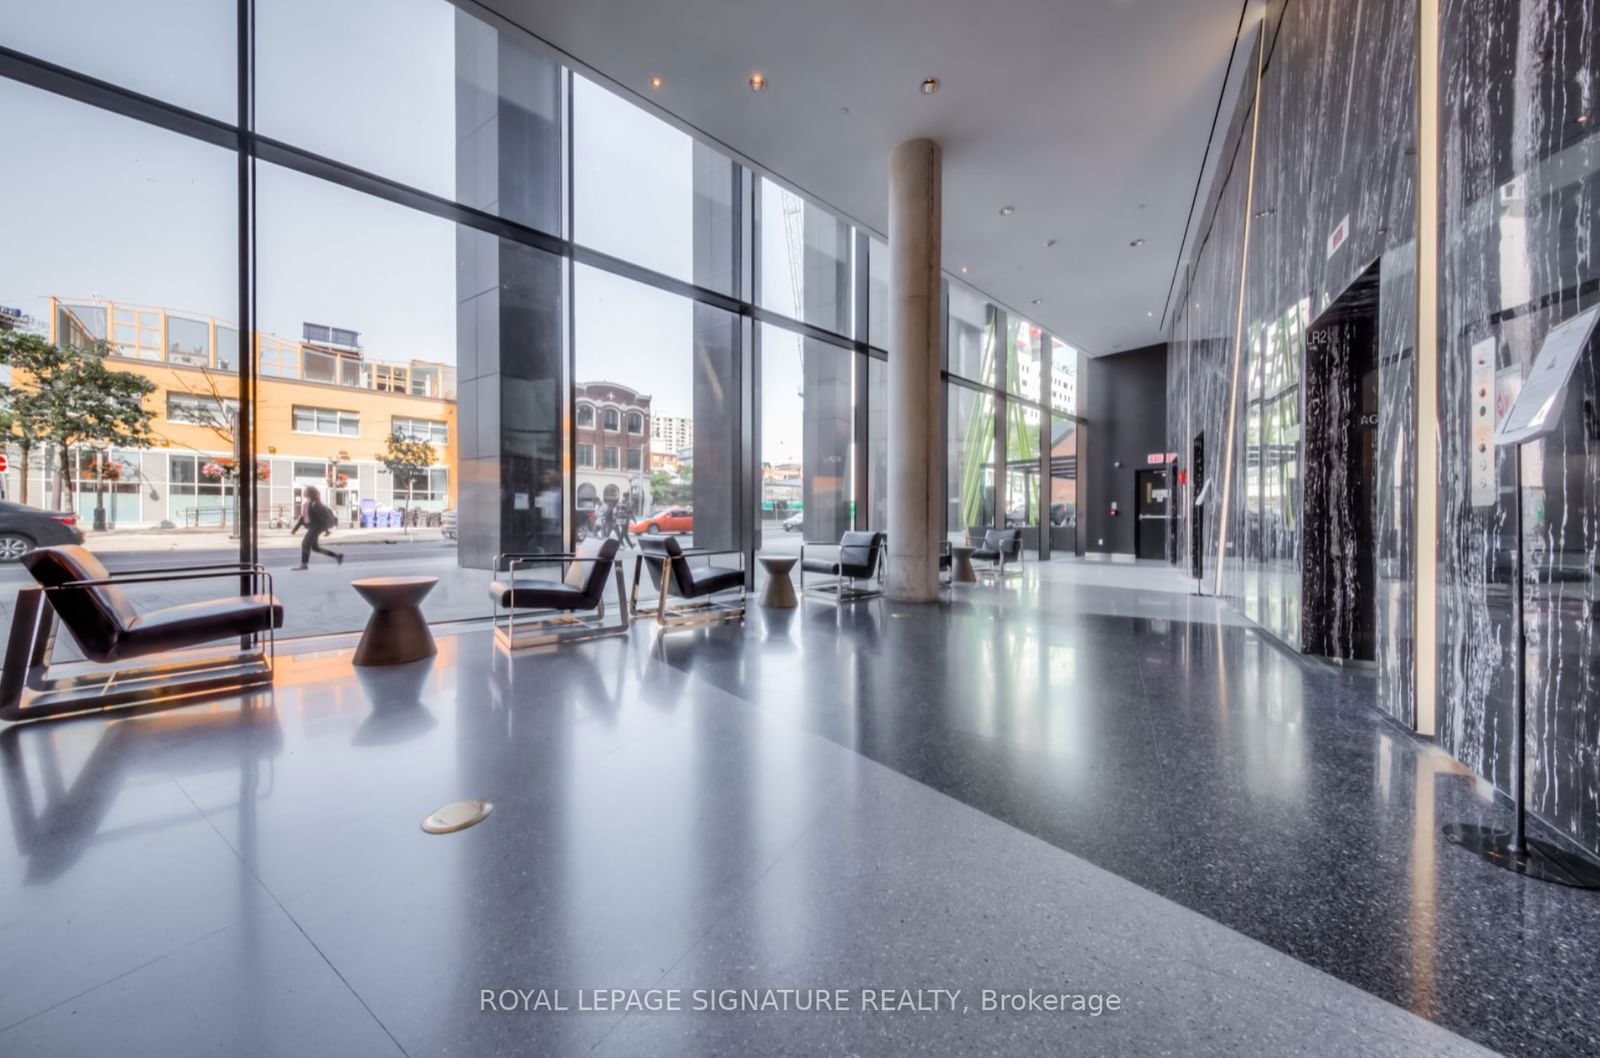
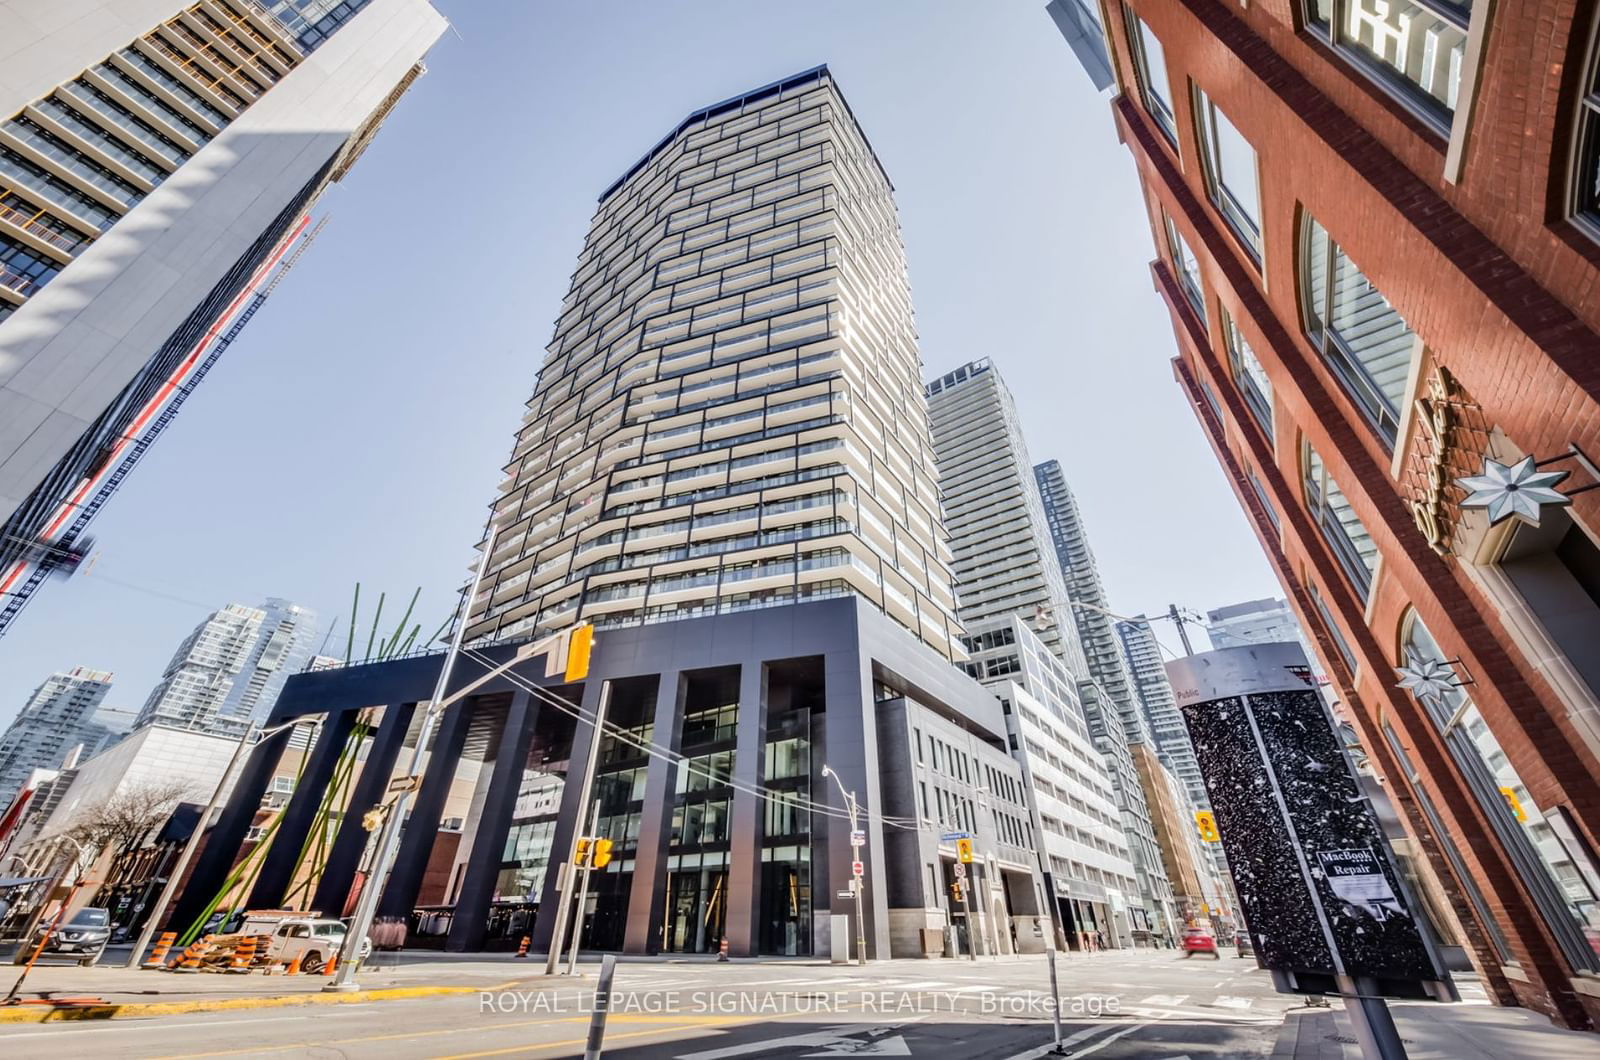
1413 - 125 Peter St
Listing History
Unit Highlights
Utilities Included
Utility Type
- Air Conditioning
- Central Air
- Heat Source
- No Data
- Heating
- Forced Air
Room Dimensions
About this Listing
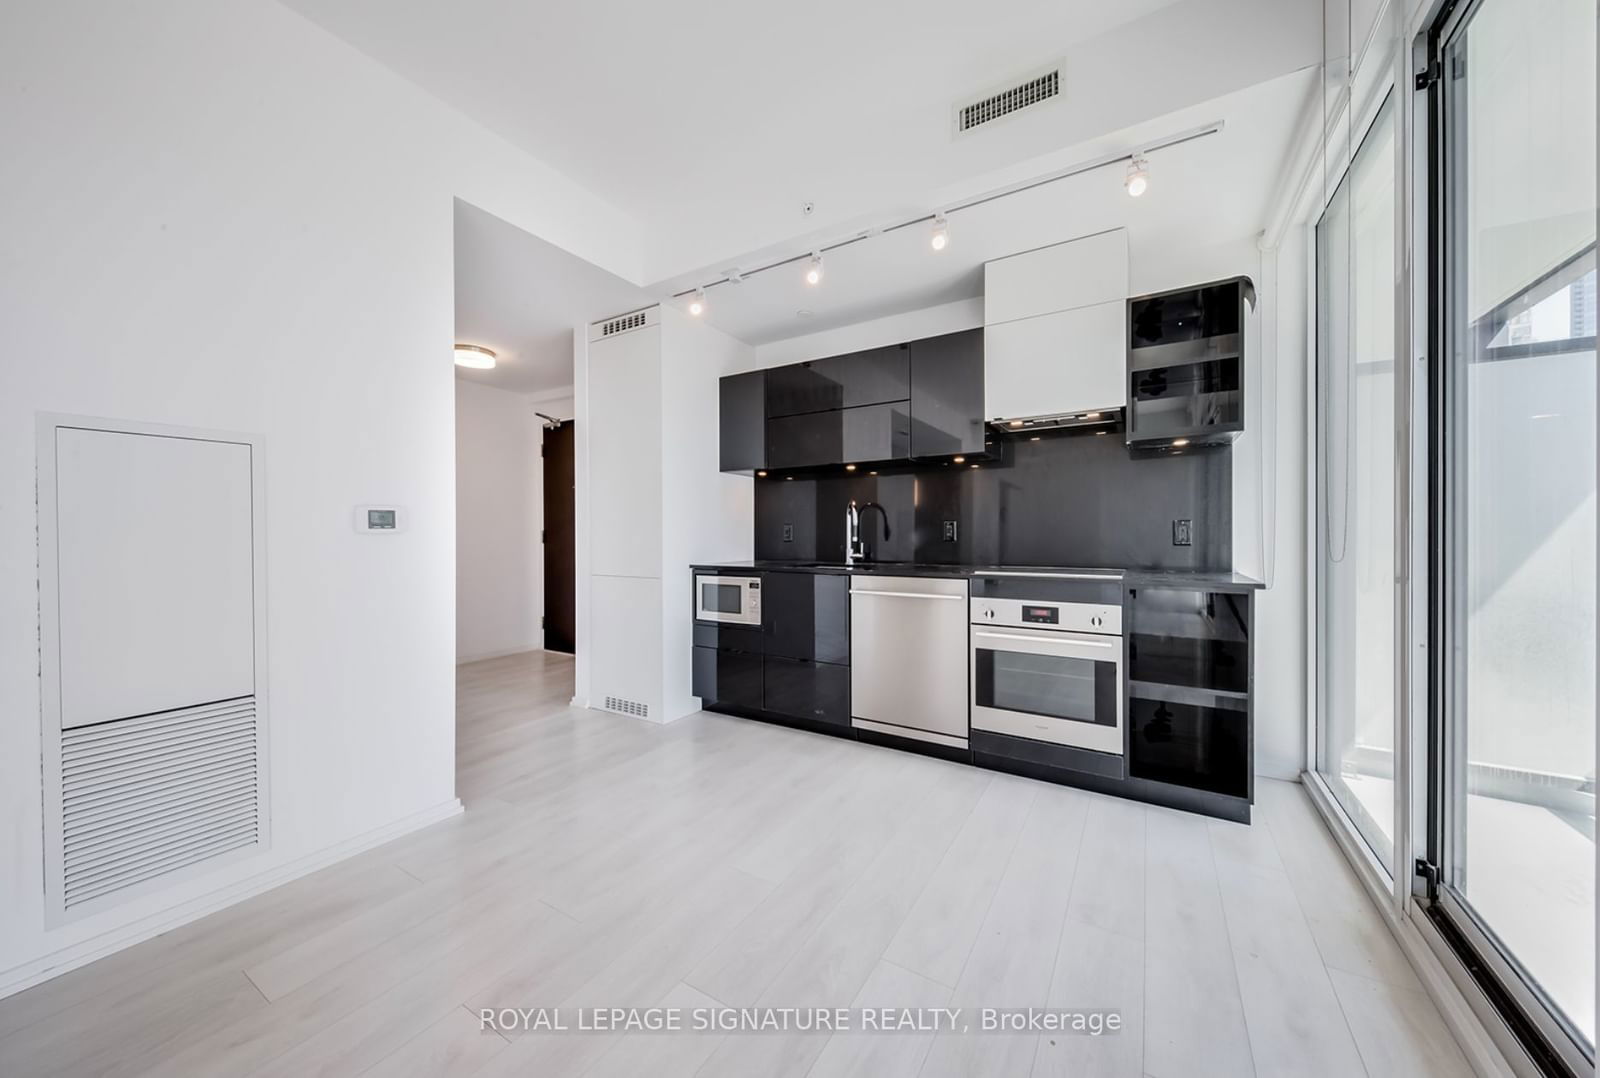
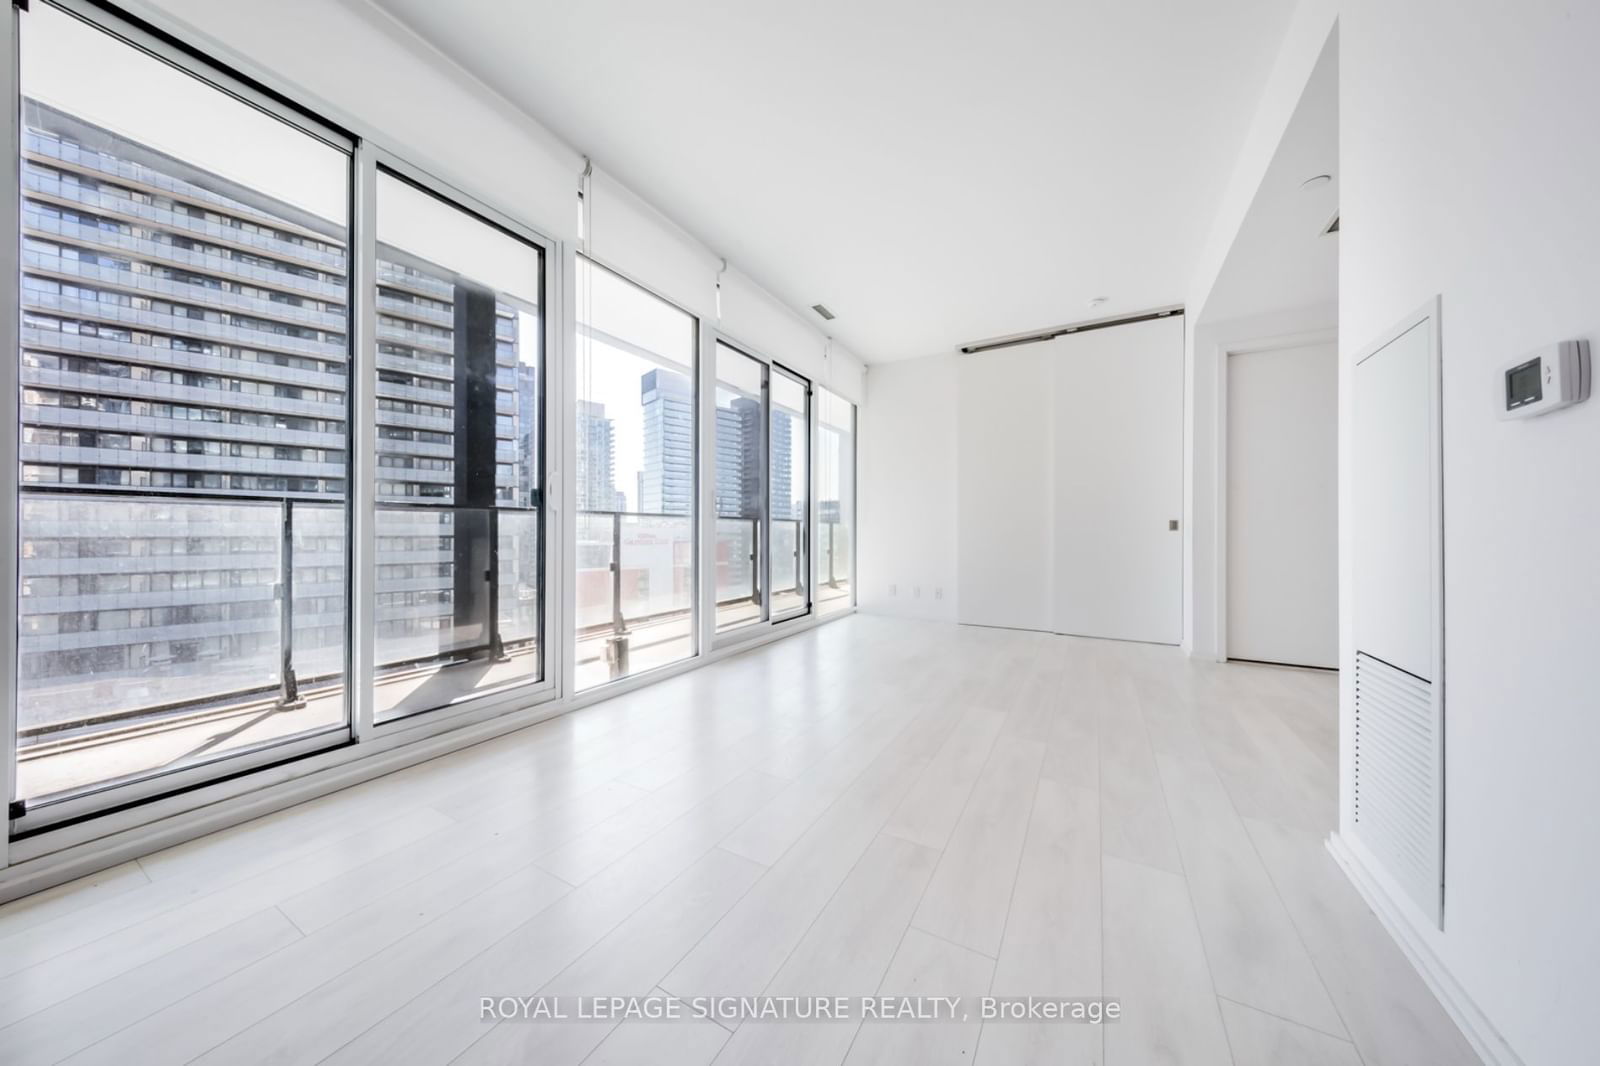
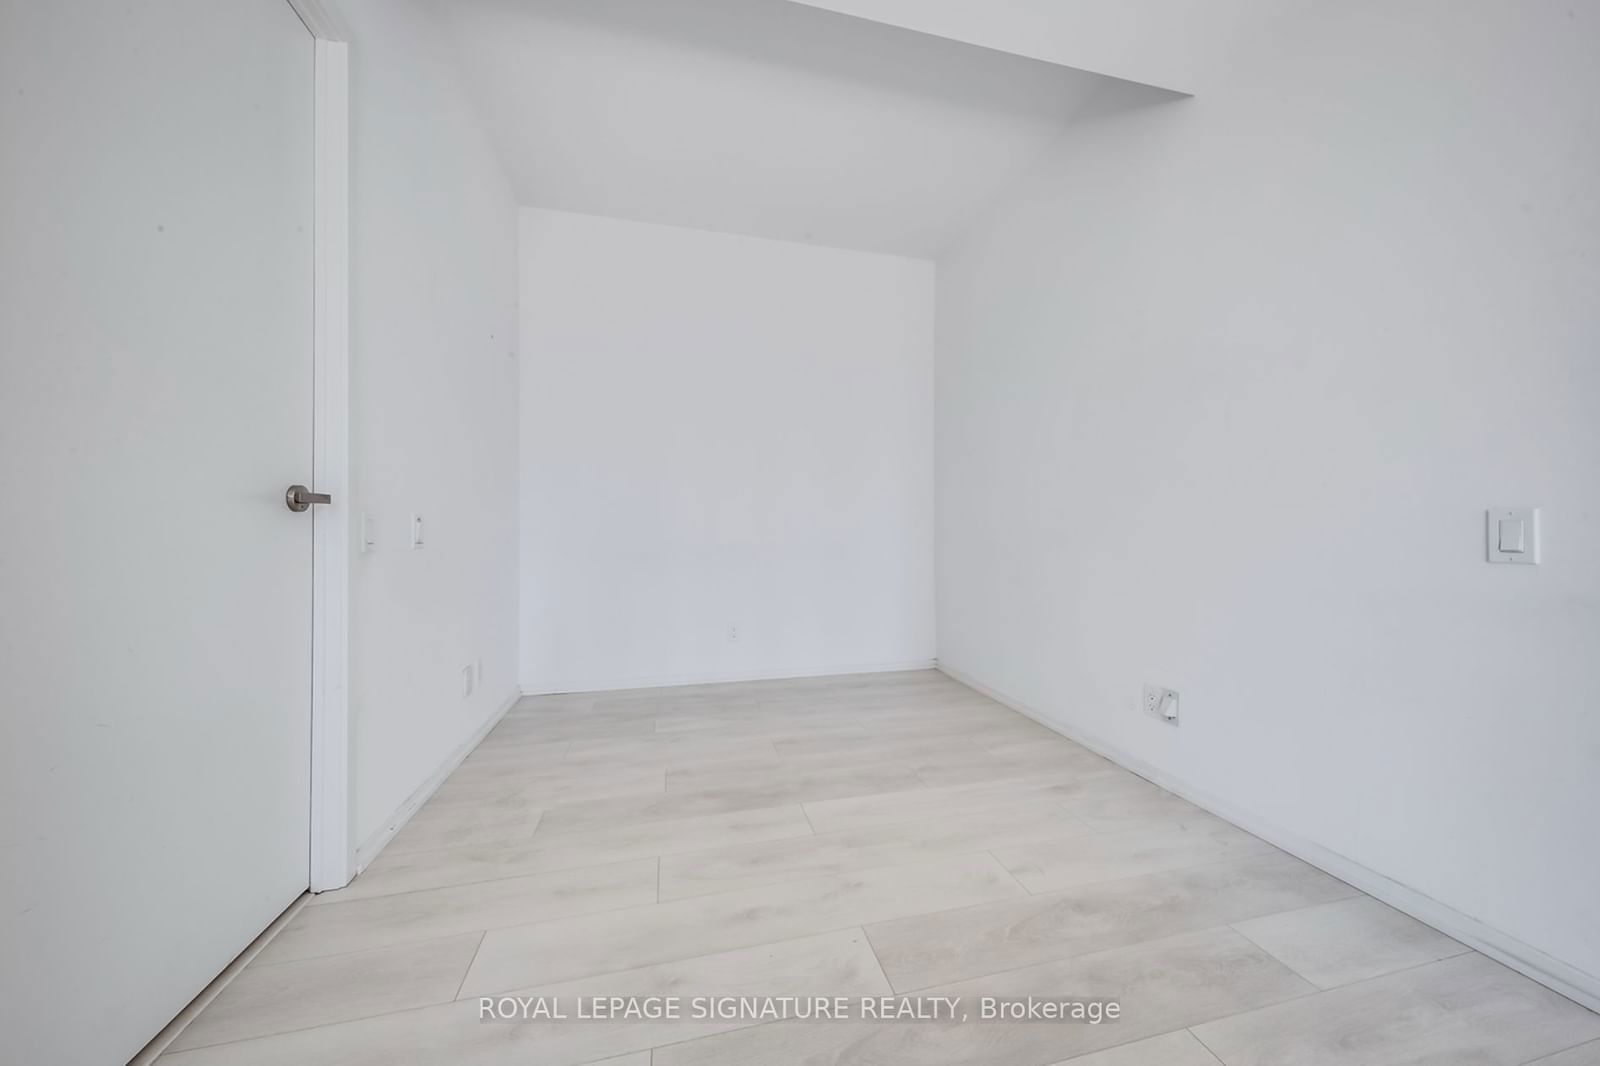
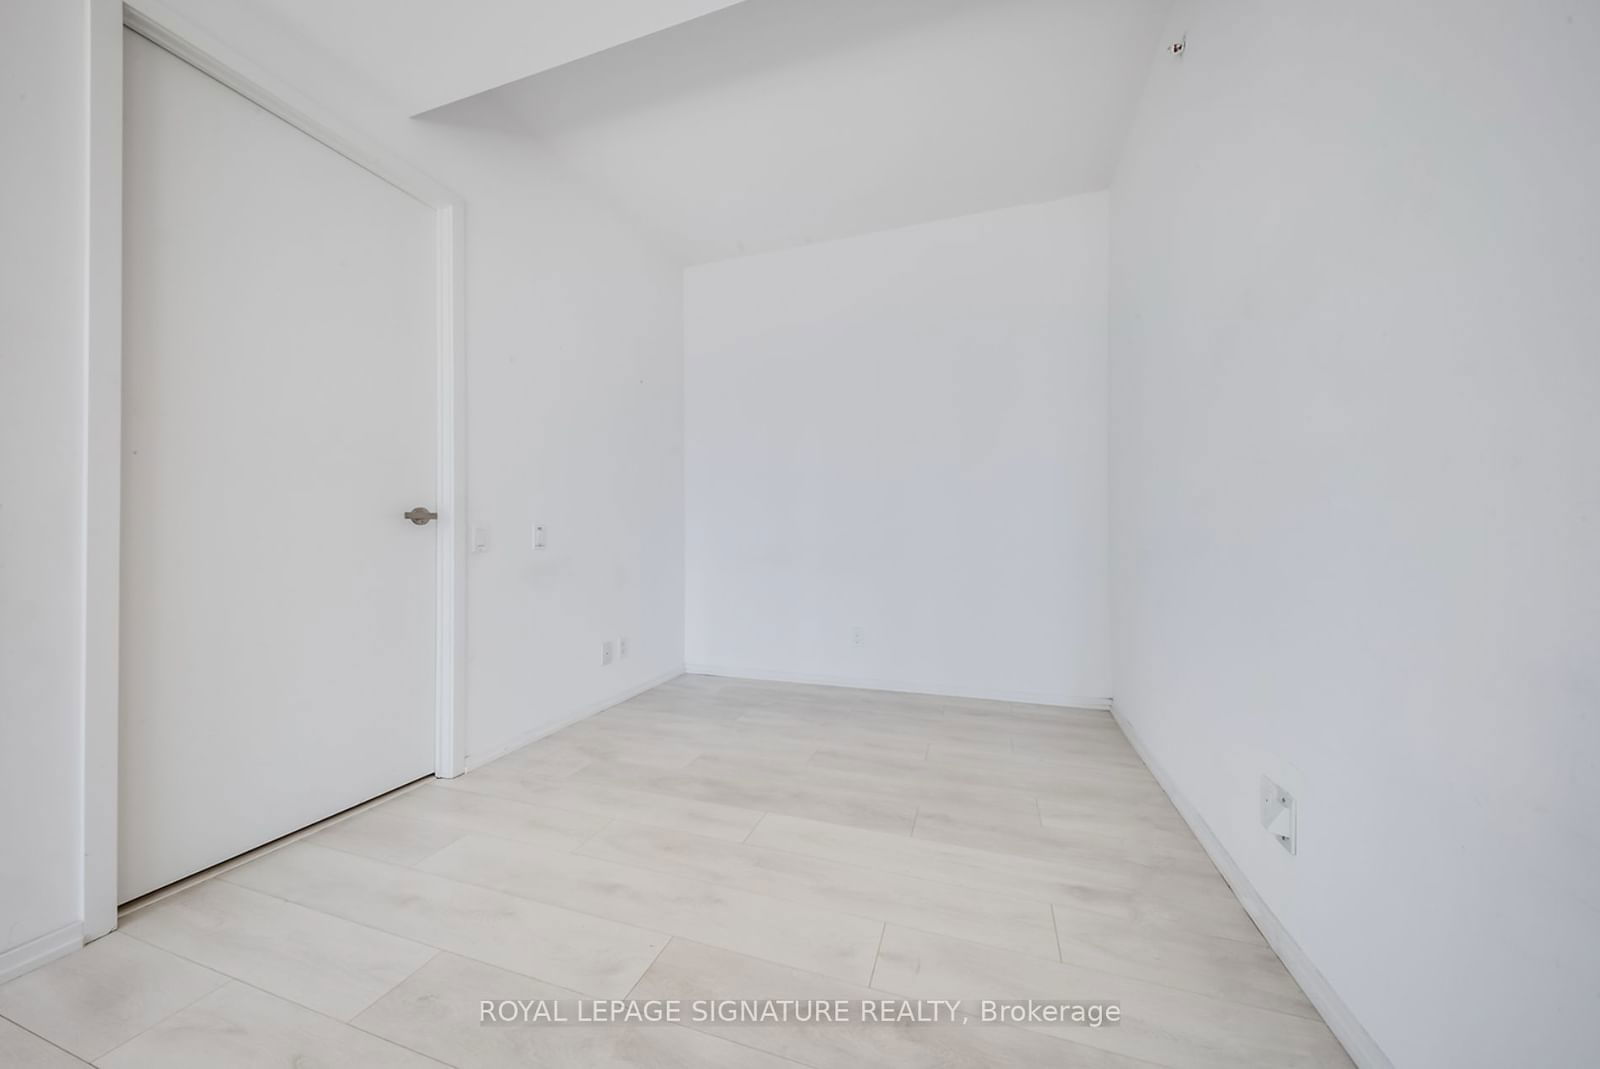
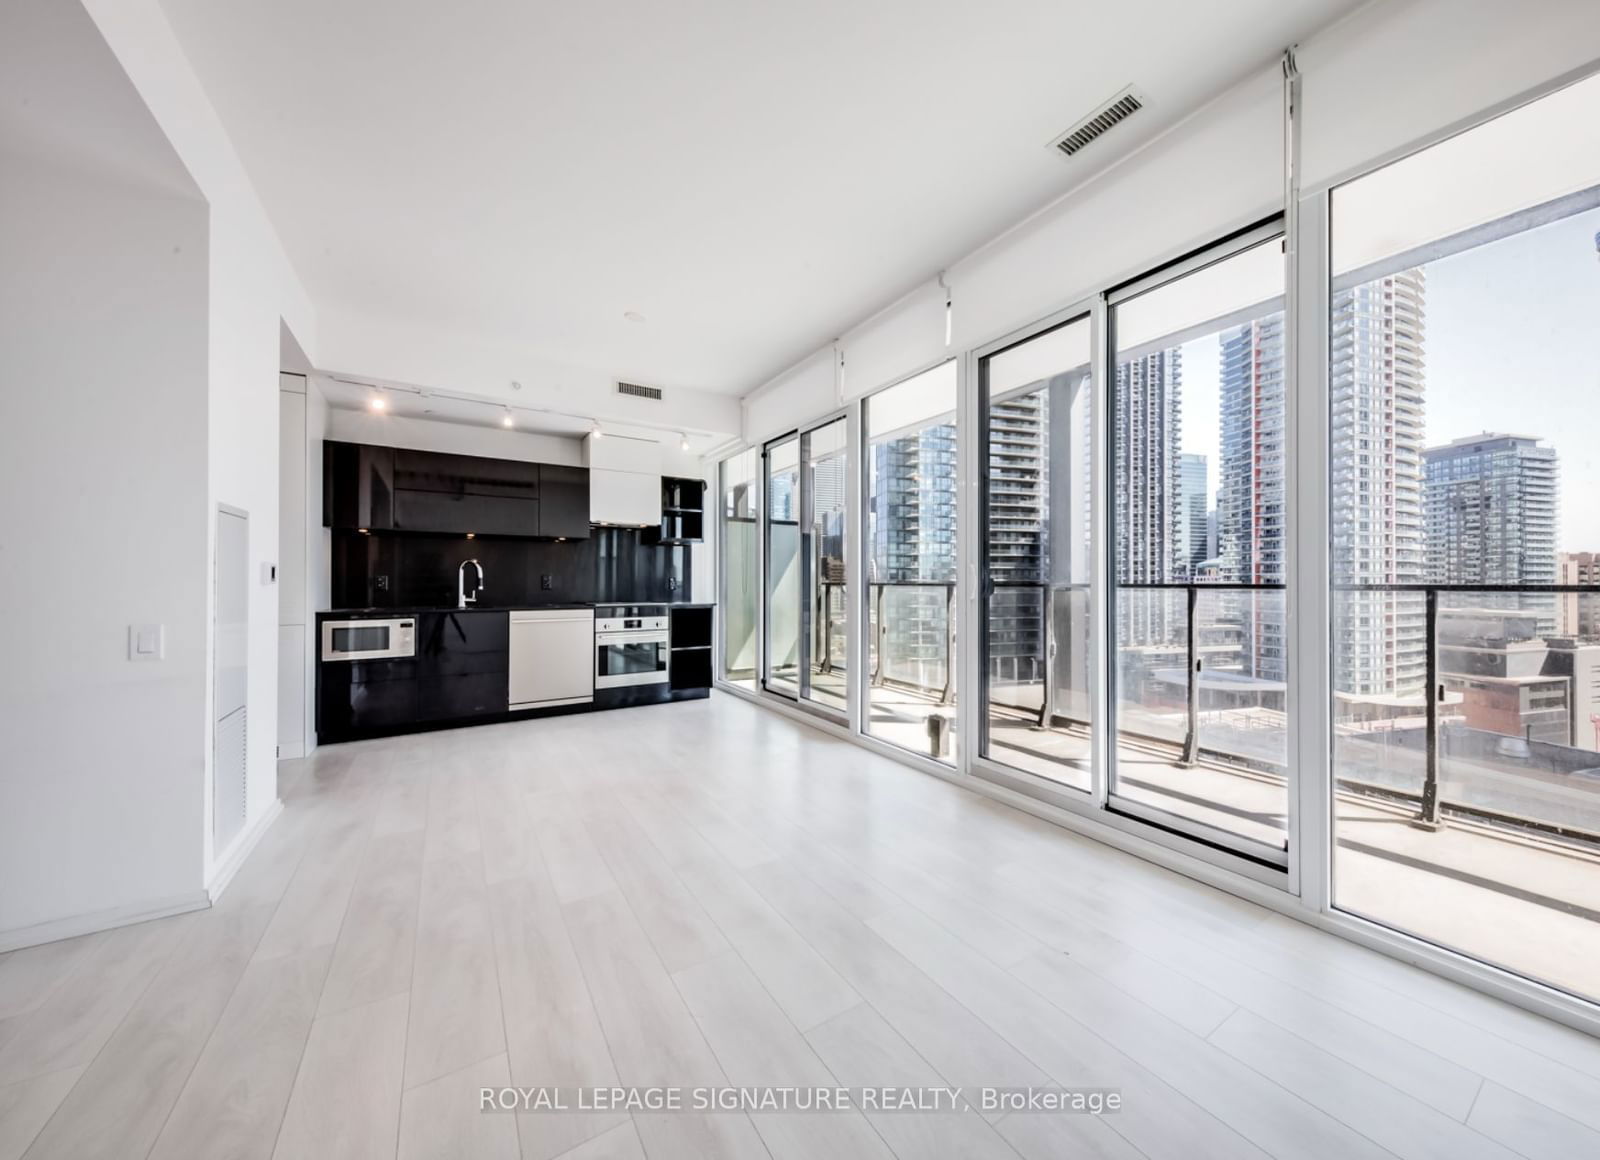
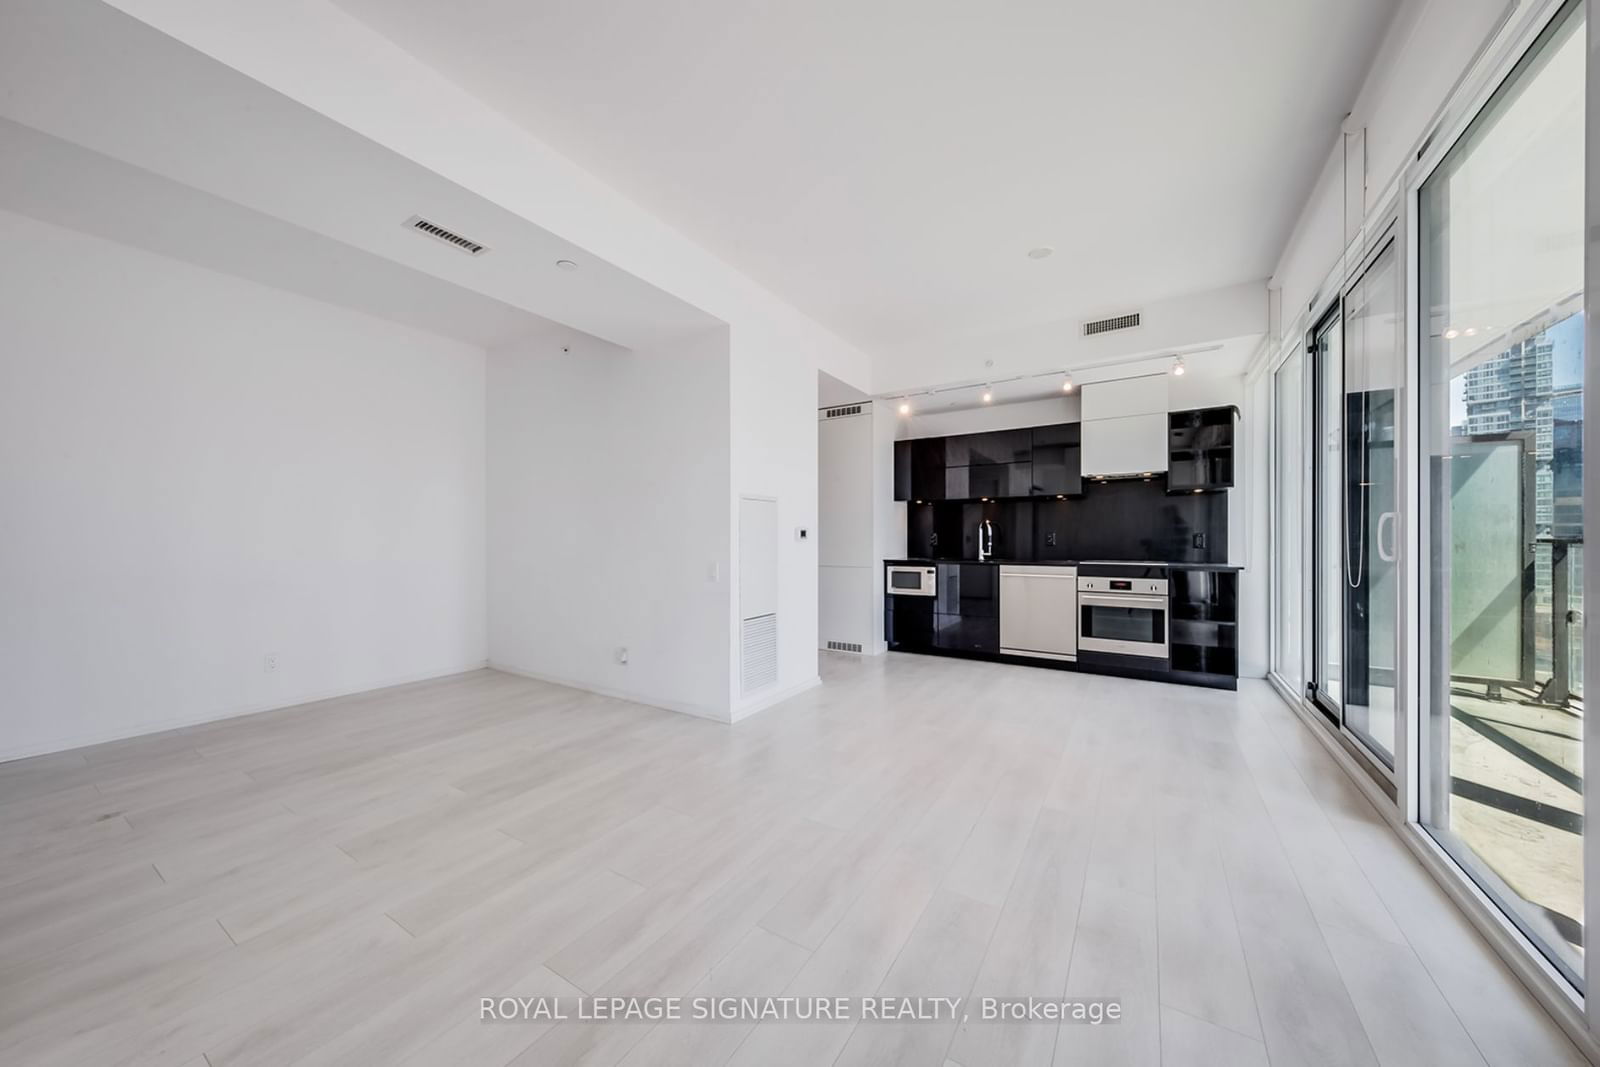
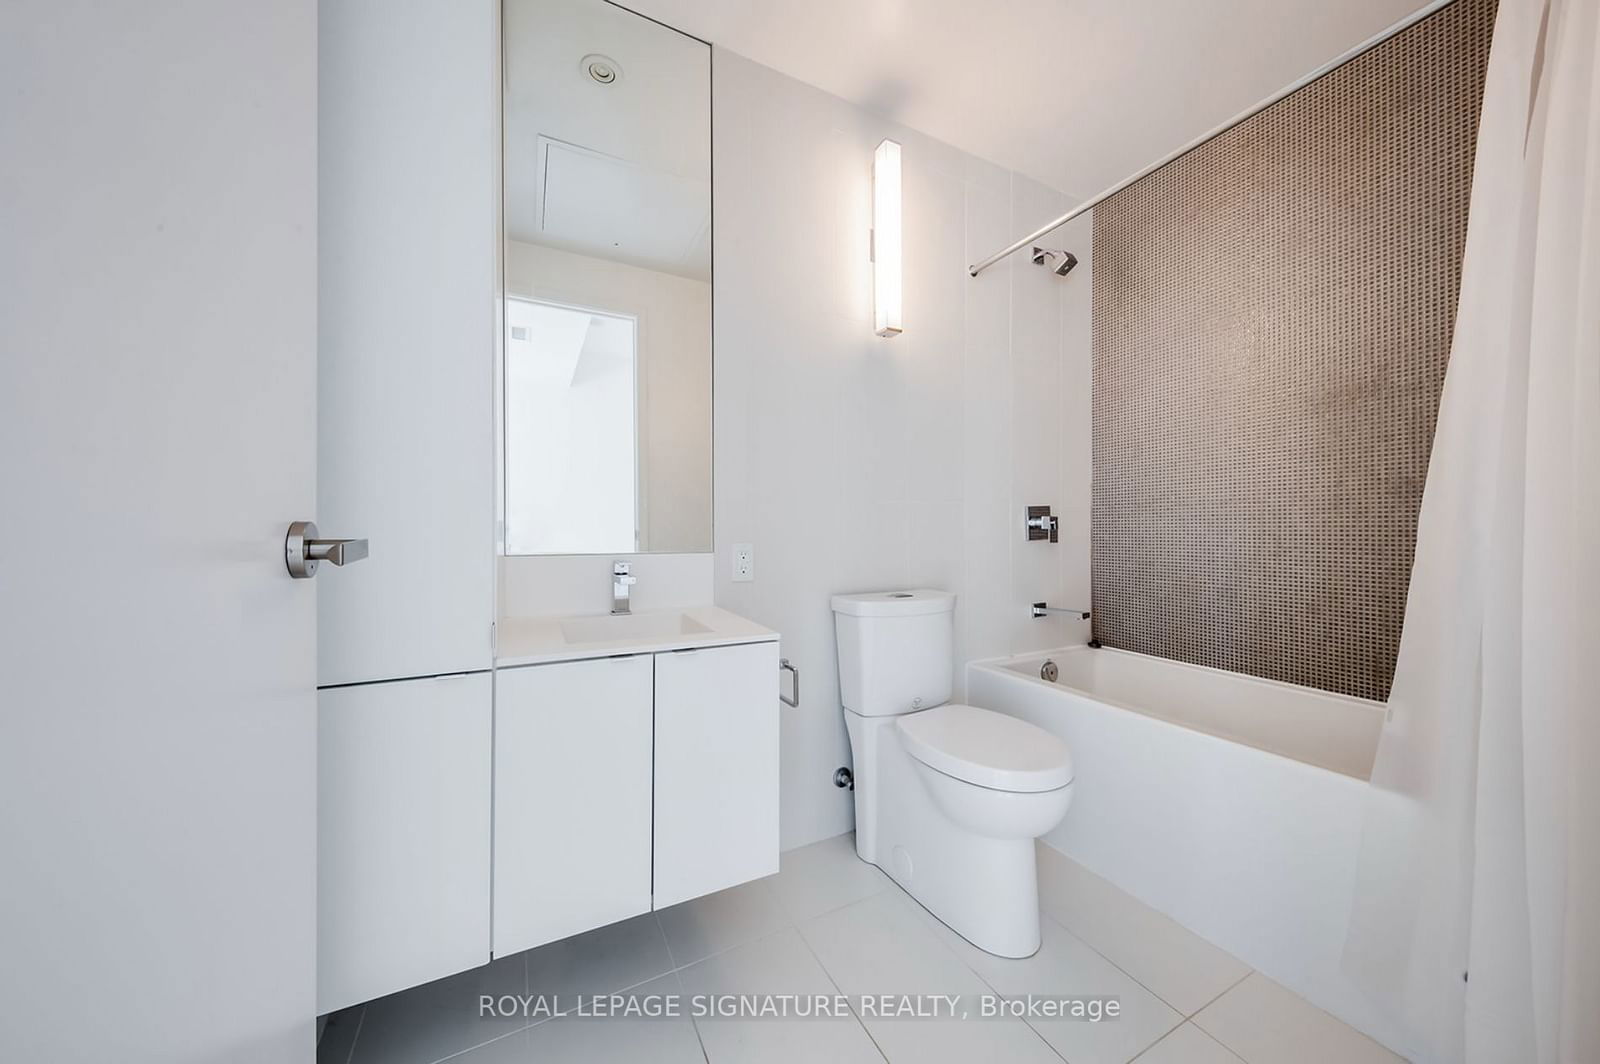
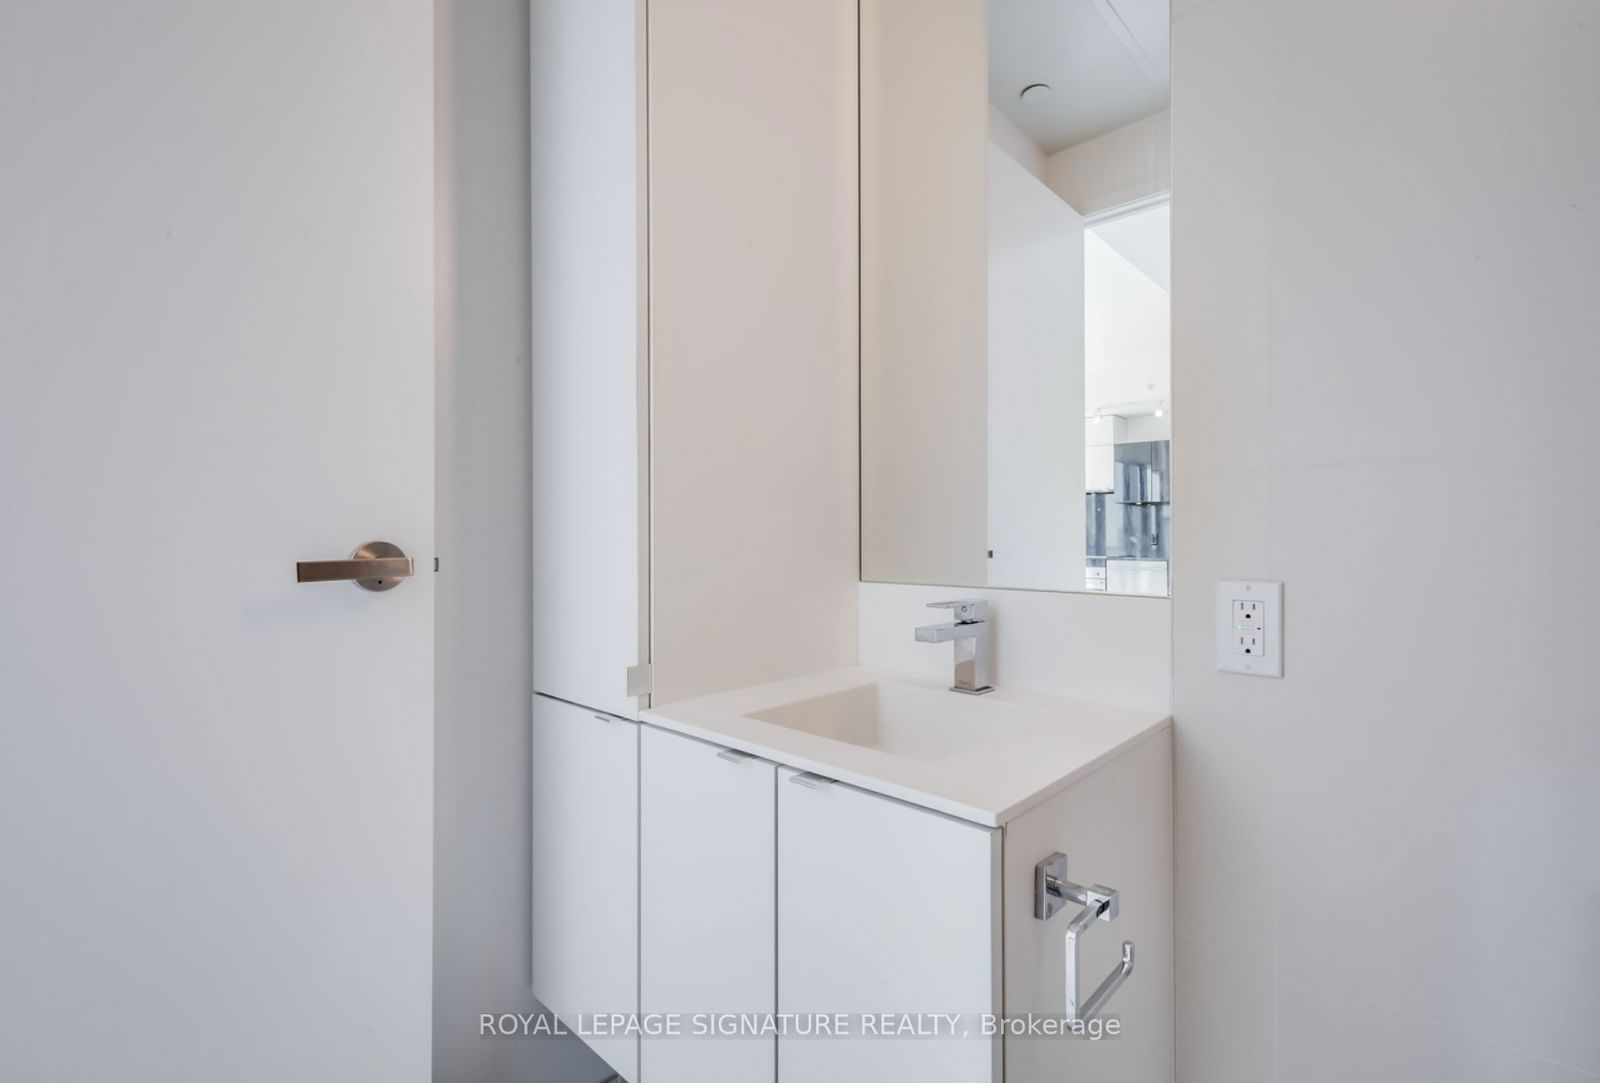
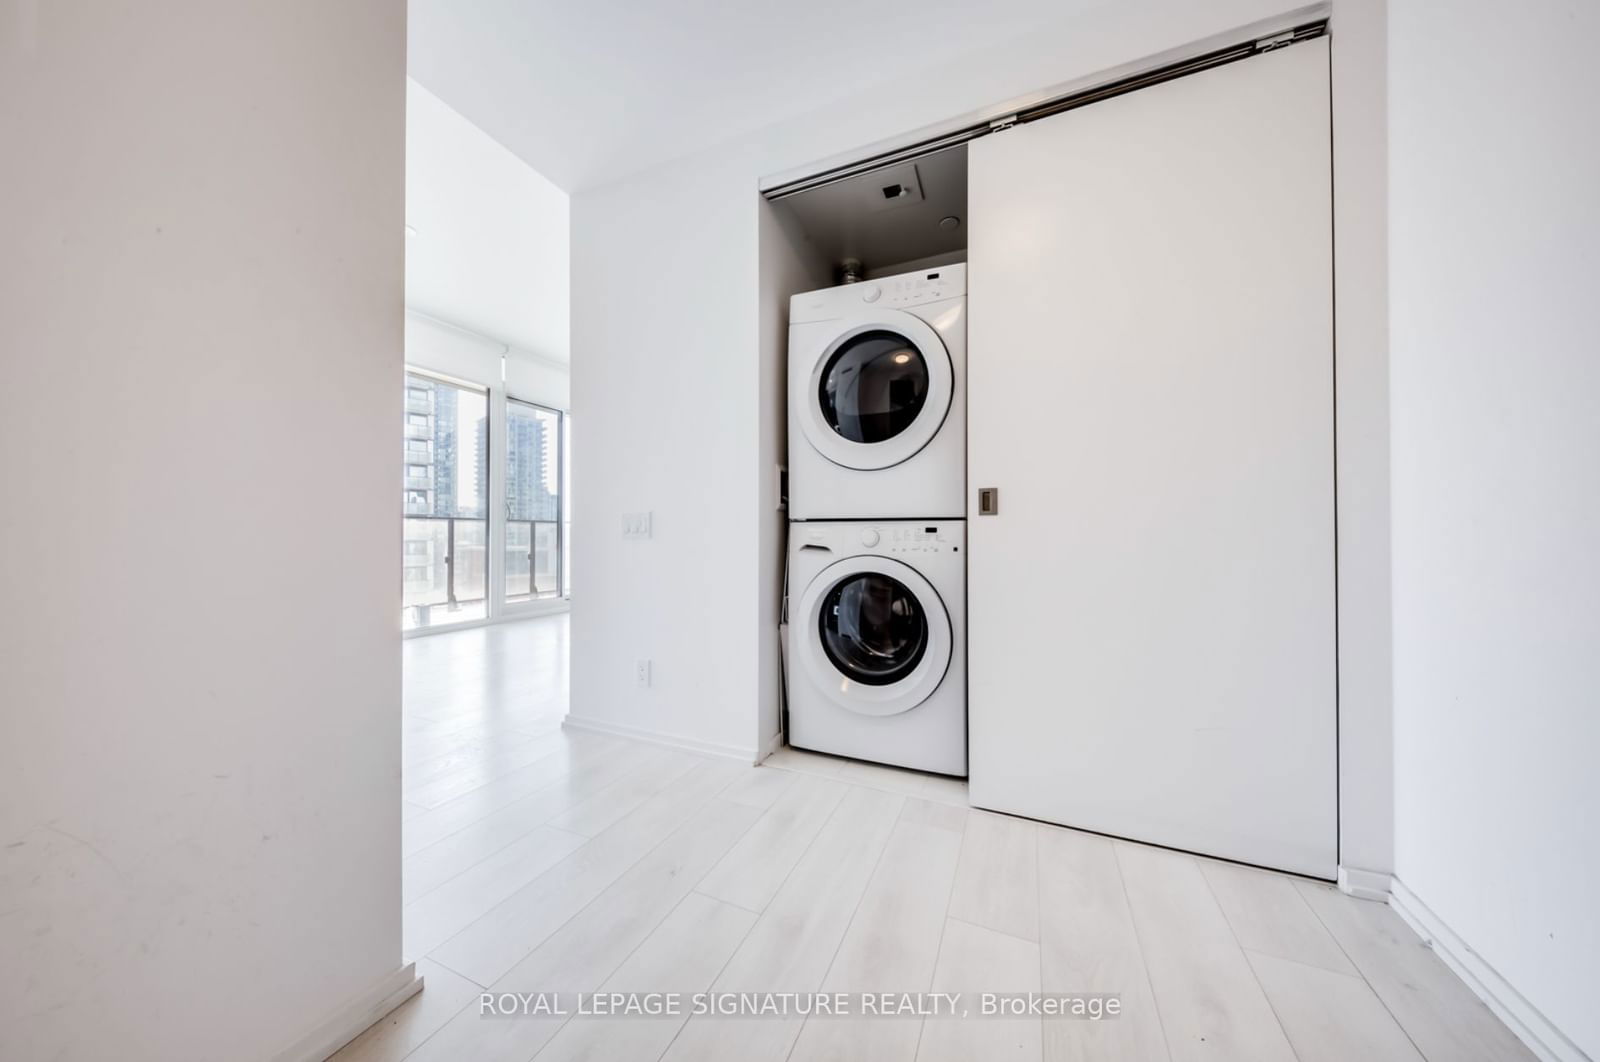
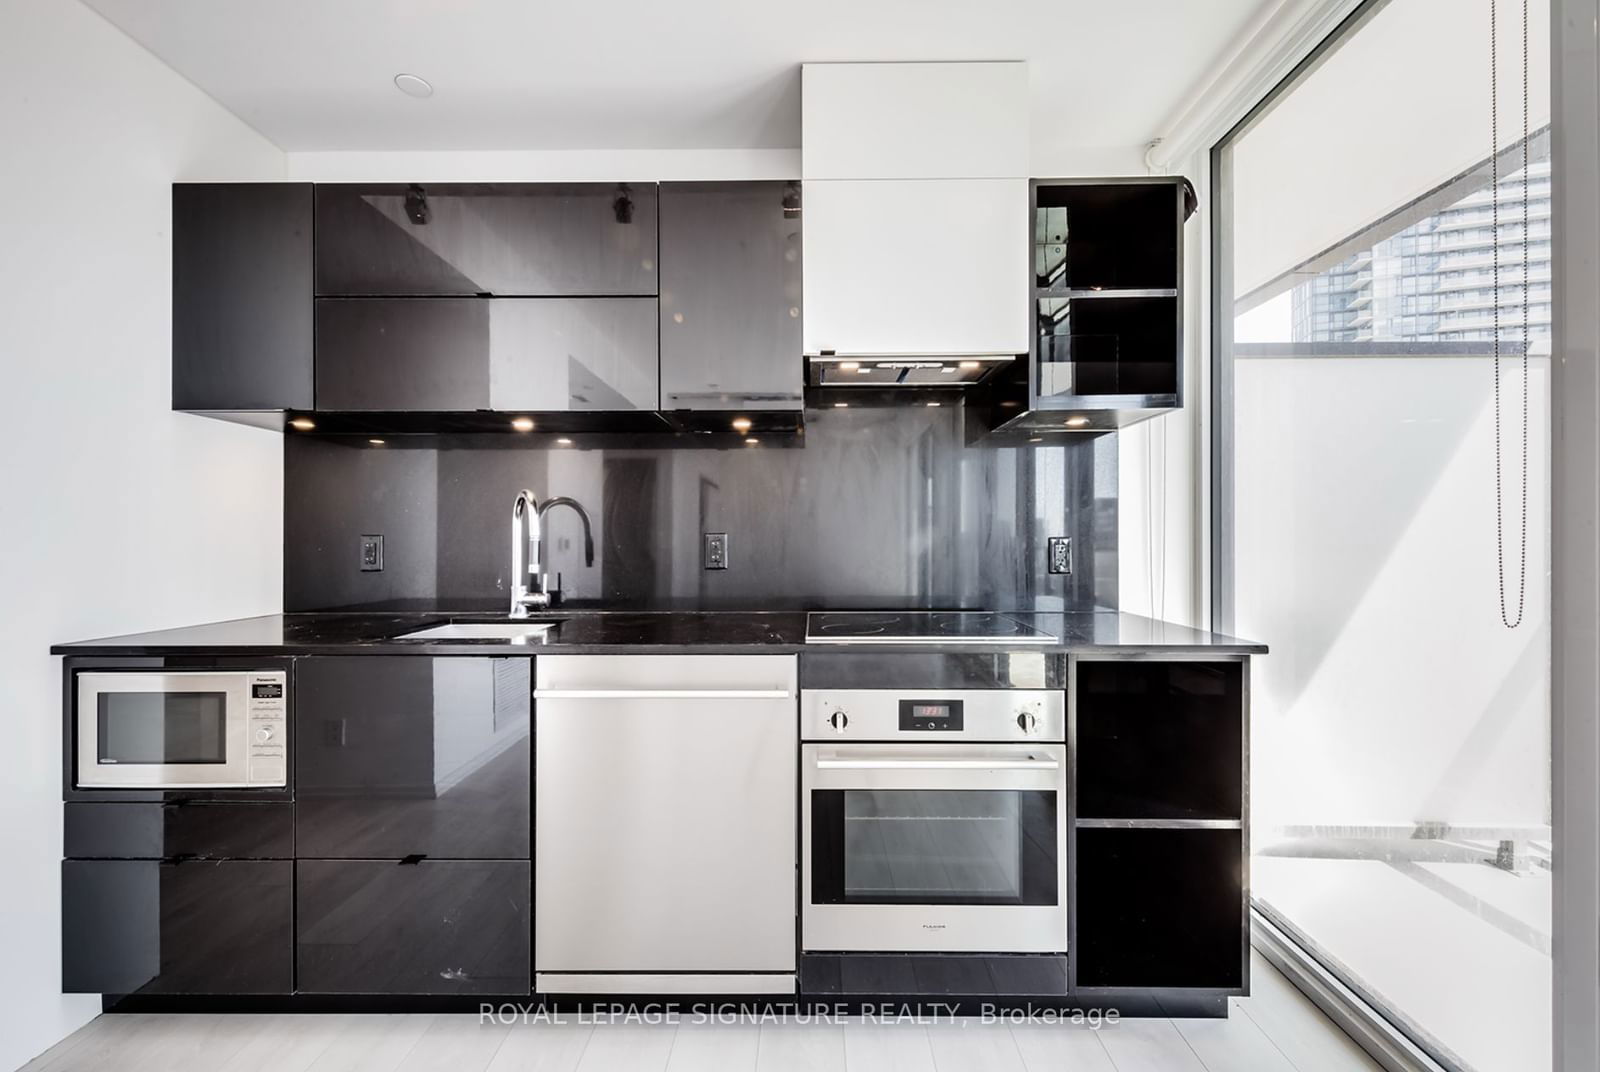
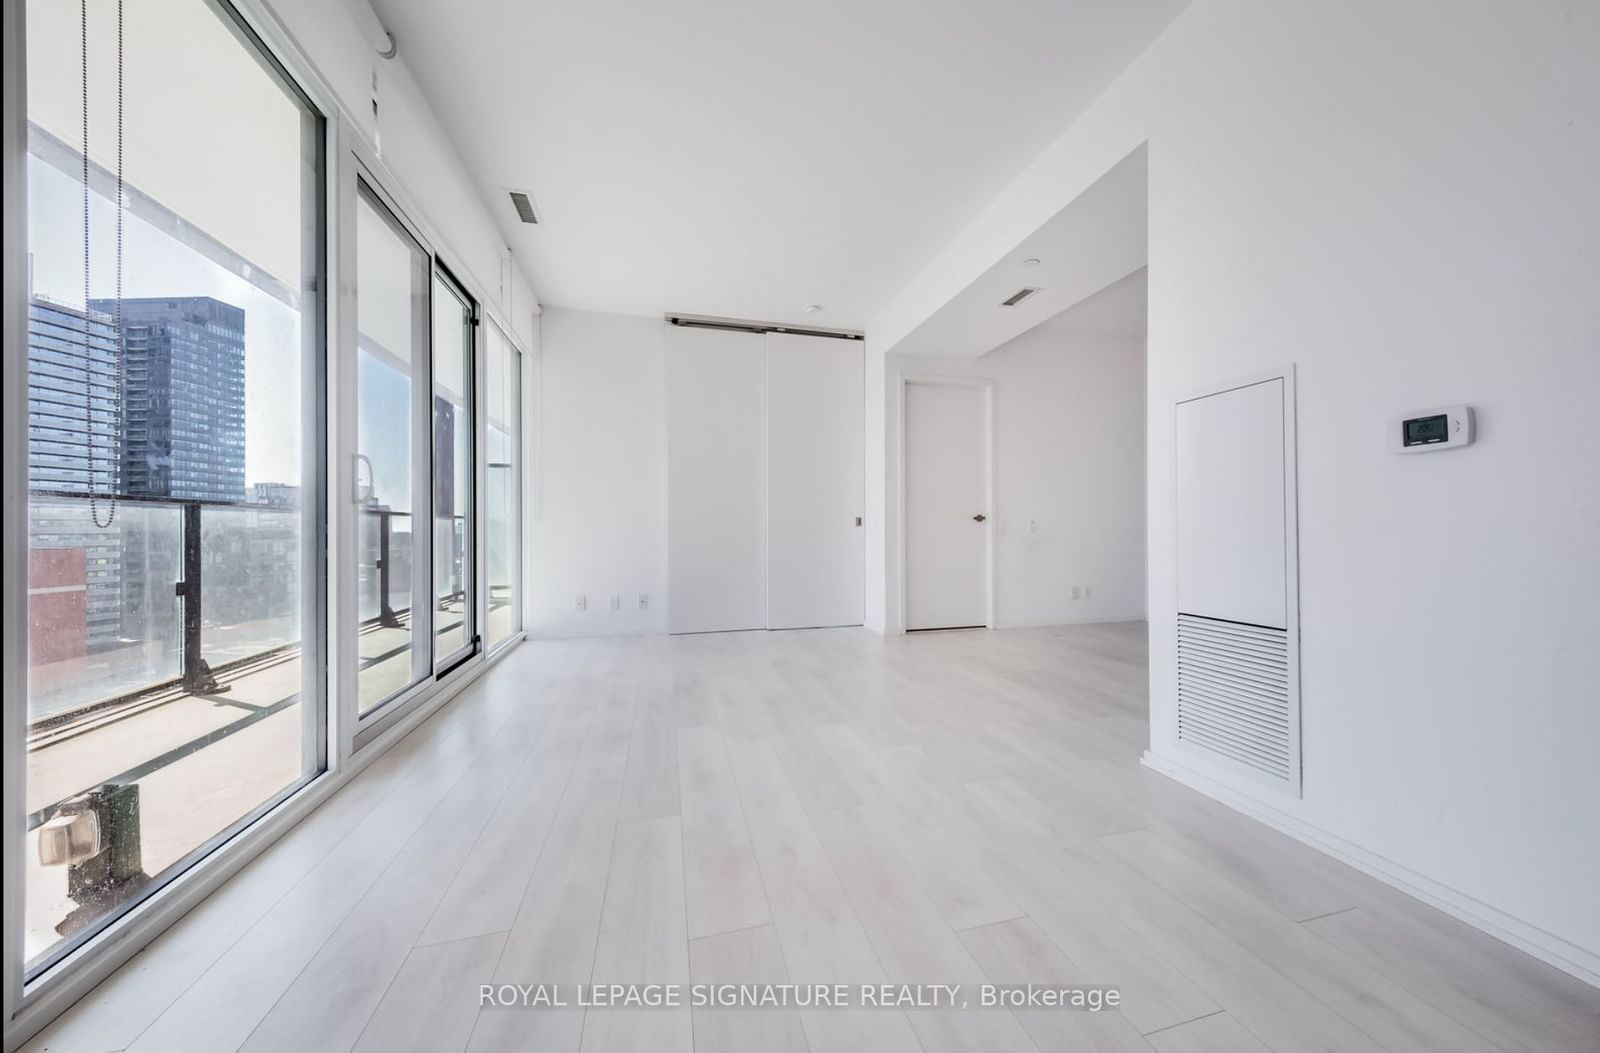
Welcome Home! This sleek and stylish one-bedroom plus den is ideal for the busy professional or young couple eager to be in the center of Torontos vibrant Entertainment District. With over 600 square feet of expertly designed space, every inch is put to good use, ensuring no wasted room. Enjoy an oversized balcony, premium upgraded appliances, and high-end finishes throughout. Plus, youre just steps away from Bay Street, the lake, and a nearby subway lineeverything you need, right at your doorstep.
ExtrasIntegrated Fridge & Freezer, Stainless Steel Flat Cook-Top Stove With Oven, Stainless Steel Built In Dishwasher, Stainless Steel Under-CounterMicrowave, Stackable Washer/Dryer, All Electrical Light Fixtures, Locker.
royal lepage signature realtyMLS® #C10411884
Amenities
Explore Neighbourhood
Similar Listings
Demographics
Based on the dissemination area as defined by Statistics Canada. A dissemination area contains, on average, approximately 200 – 400 households.
Price Trends
Maintenance Fees
Building Trends At Tableau Condominiums
Days on Strata
List vs Selling Price
Offer Competition
Turnover of Units
Property Value
Price Ranking
Sold Units
Rented Units
Best Value Rank
Appreciation Rank
Rental Yield
High Demand
Transaction Insights at 125 Peter Street
| Studio | 1 Bed | 1 Bed + Den | 2 Bed | 3 Bed | 3 Bed + Den | |
|---|---|---|---|---|---|---|
| Price Range | No Data | $520,000 | $575,000 - $682,500 | $725,000 - $818,000 | No Data | No Data |
| Avg. Cost Per Sqft | No Data | $1,000 | $1,059 | $1,202 | No Data | No Data |
| Price Range | $2,000 - $2,250 | $2,075 - $2,450 | $2,400 - $3,100 | $2,700 - $3,600 | $3,700 - $4,600 | No Data |
| Avg. Wait for Unit Availability | 381 Days | 93 Days | 30 Days | 49 Days | 157 Days | No Data |
| Avg. Wait for Unit Availability | 61 Days | 21 Days | 10 Days | 19 Days | 55 Days | No Data |
| Ratio of Units in Building | 7% | 19% | 42% | 24% | 10% | 1% |
Transactions vs Inventory
Total number of units listed and leased in Queen West
