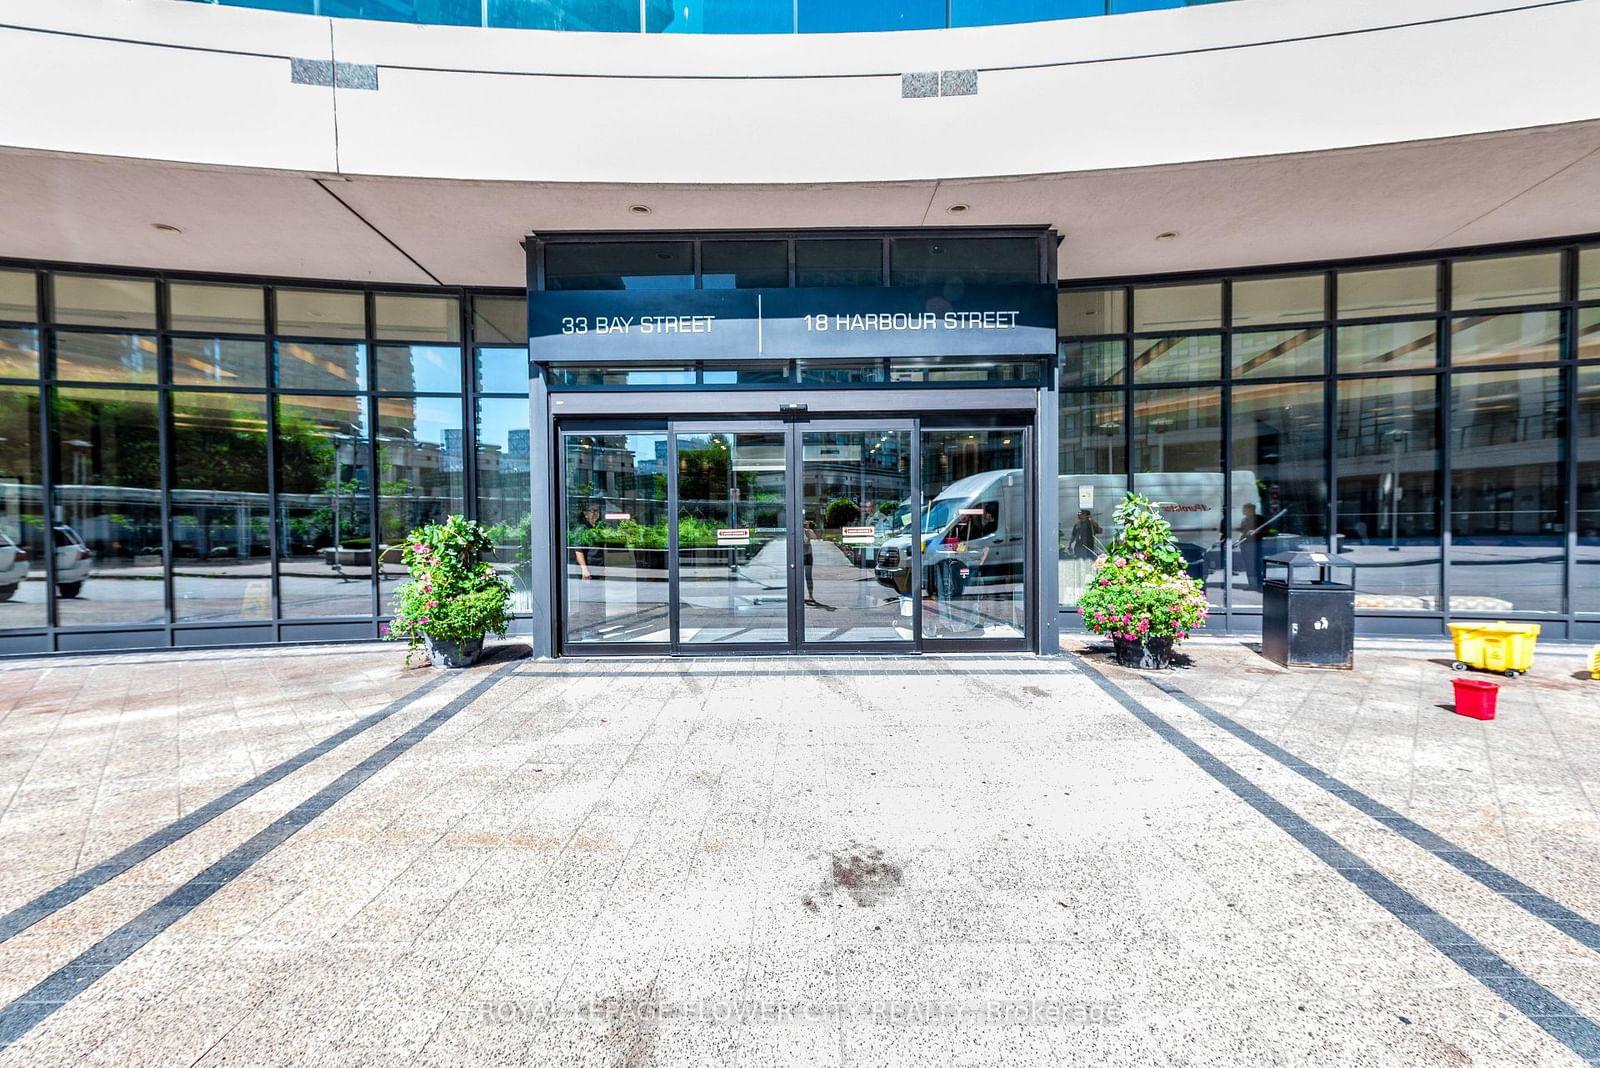
1001 - 18 Harbour St
Listing History
Unit Highlights
About this Listing
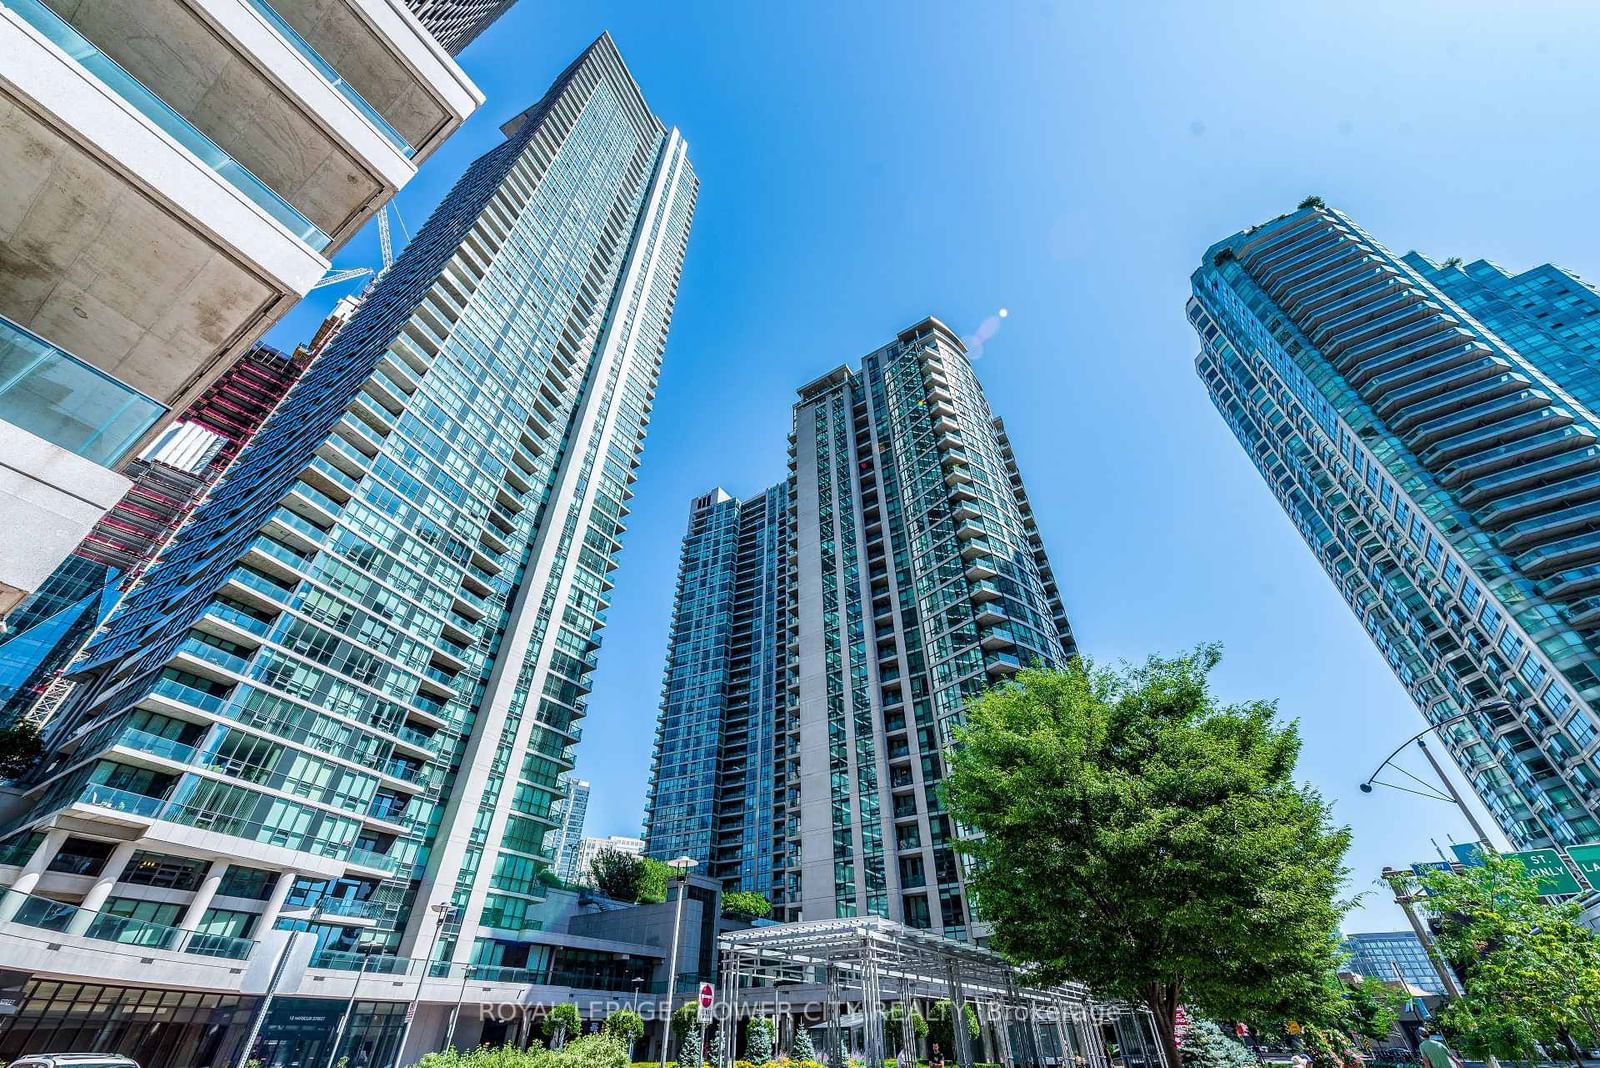
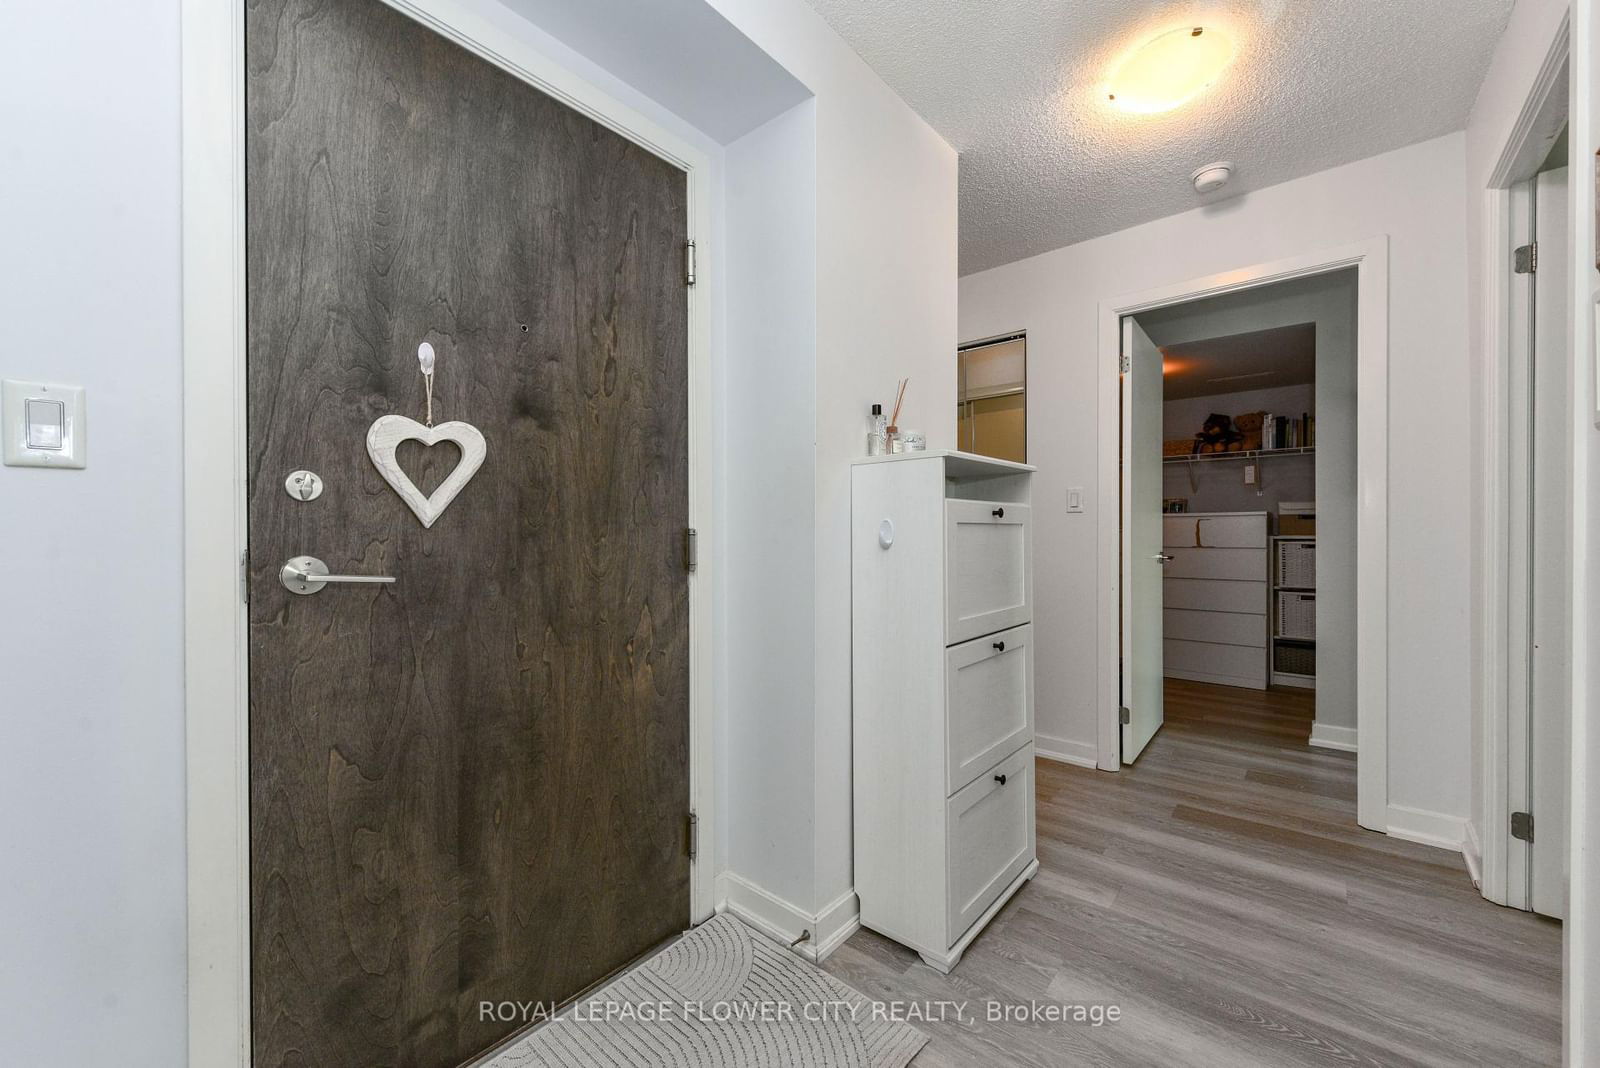
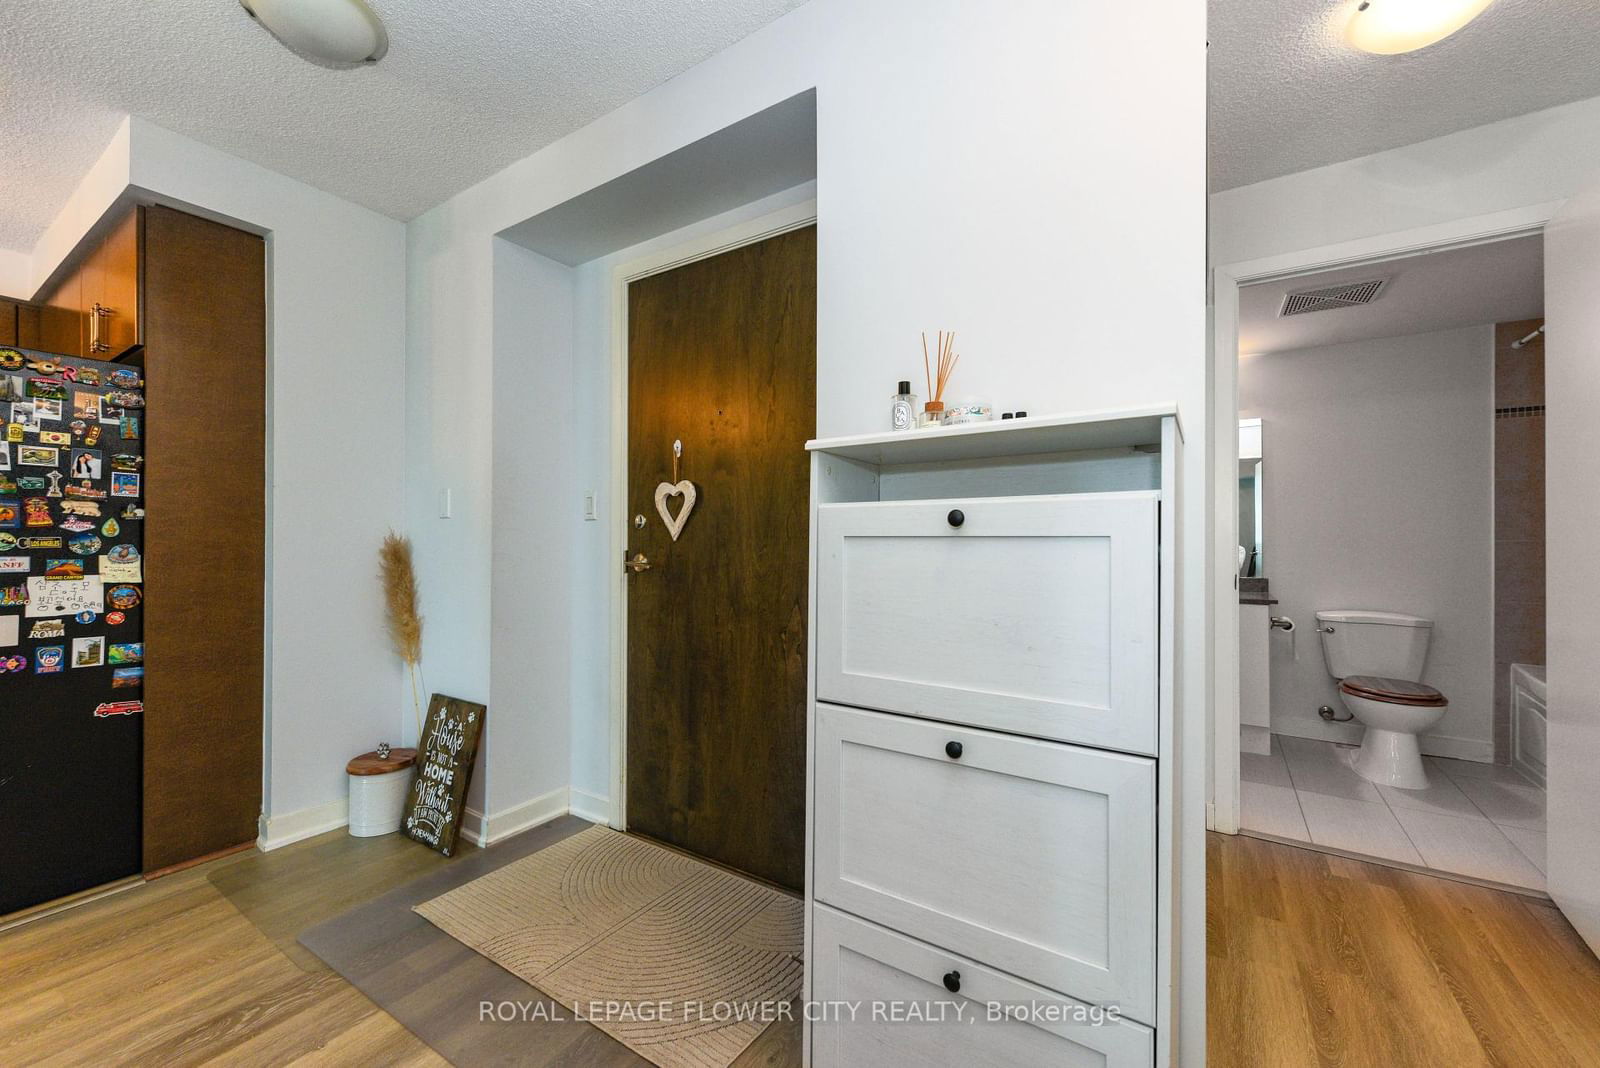
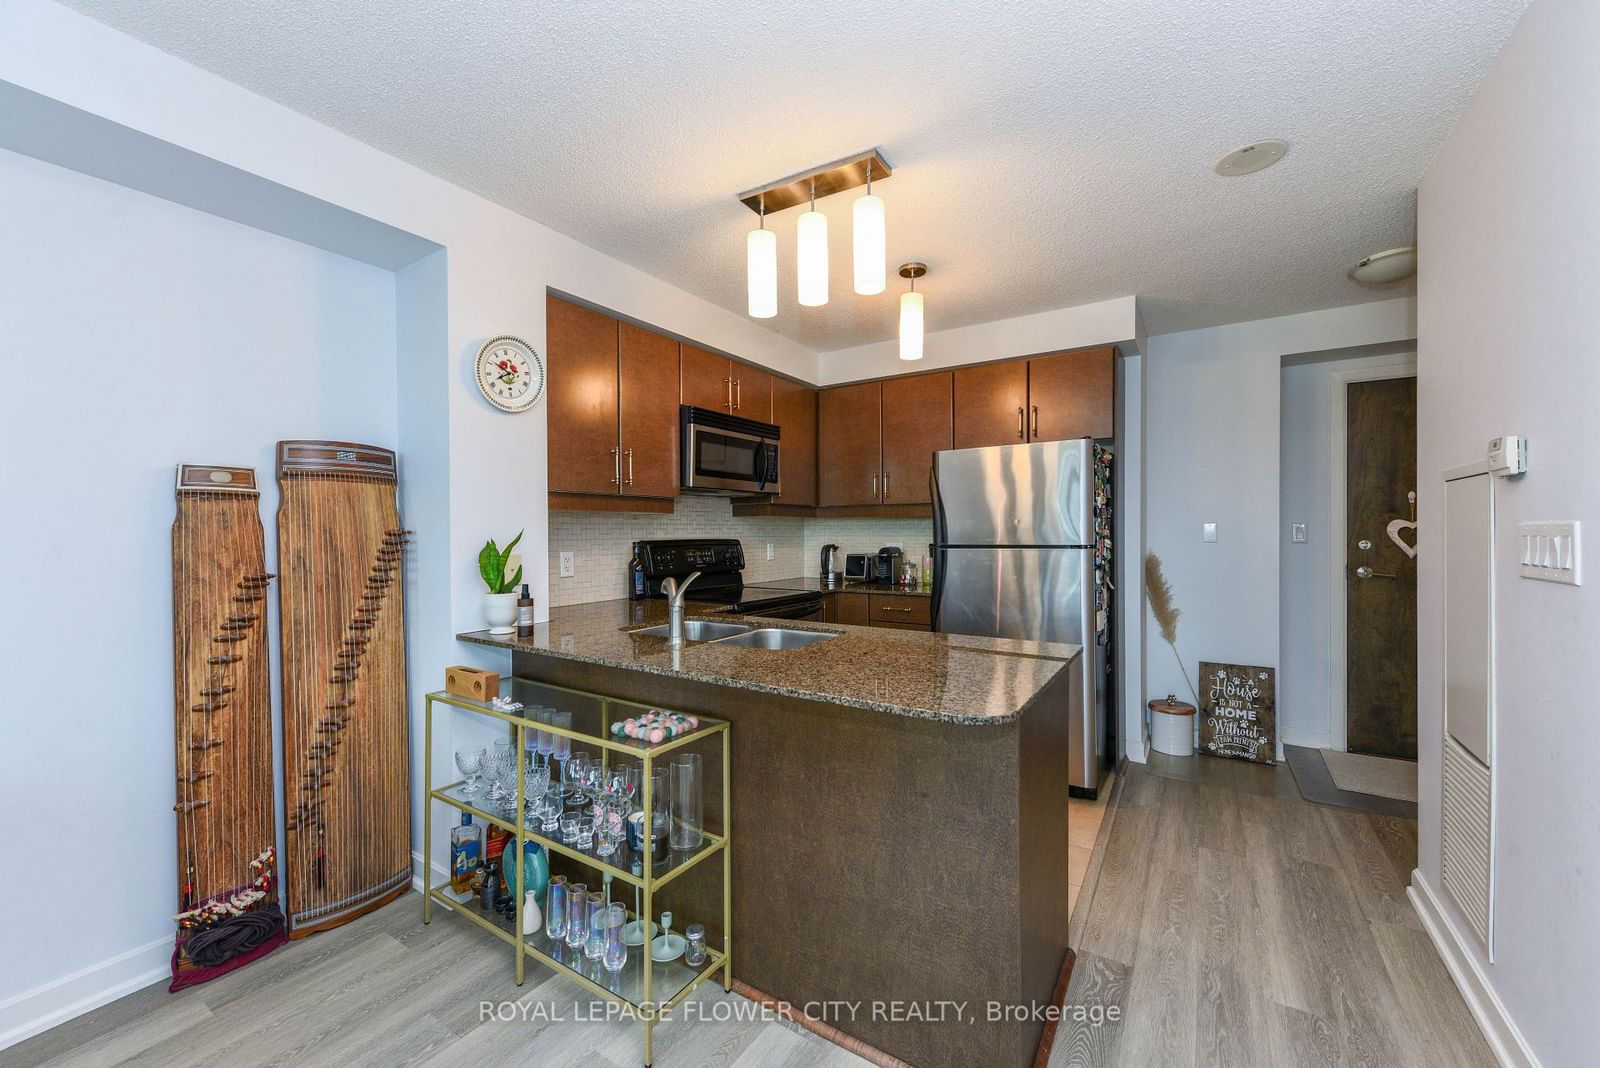
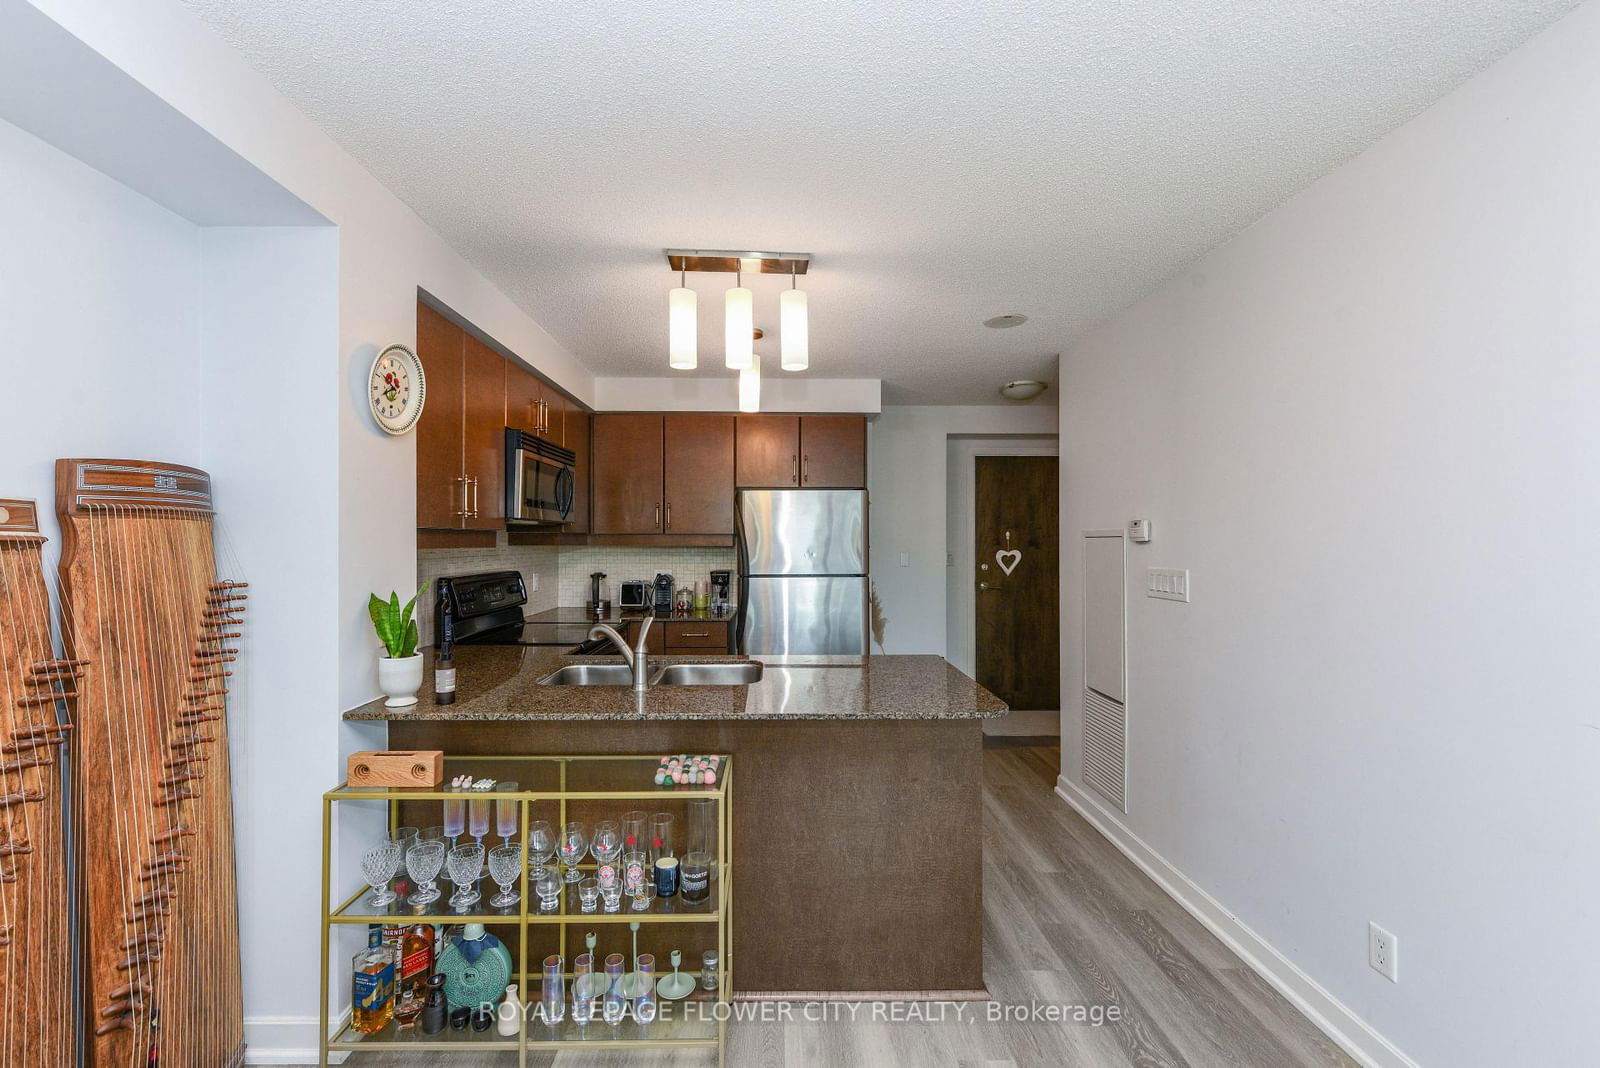
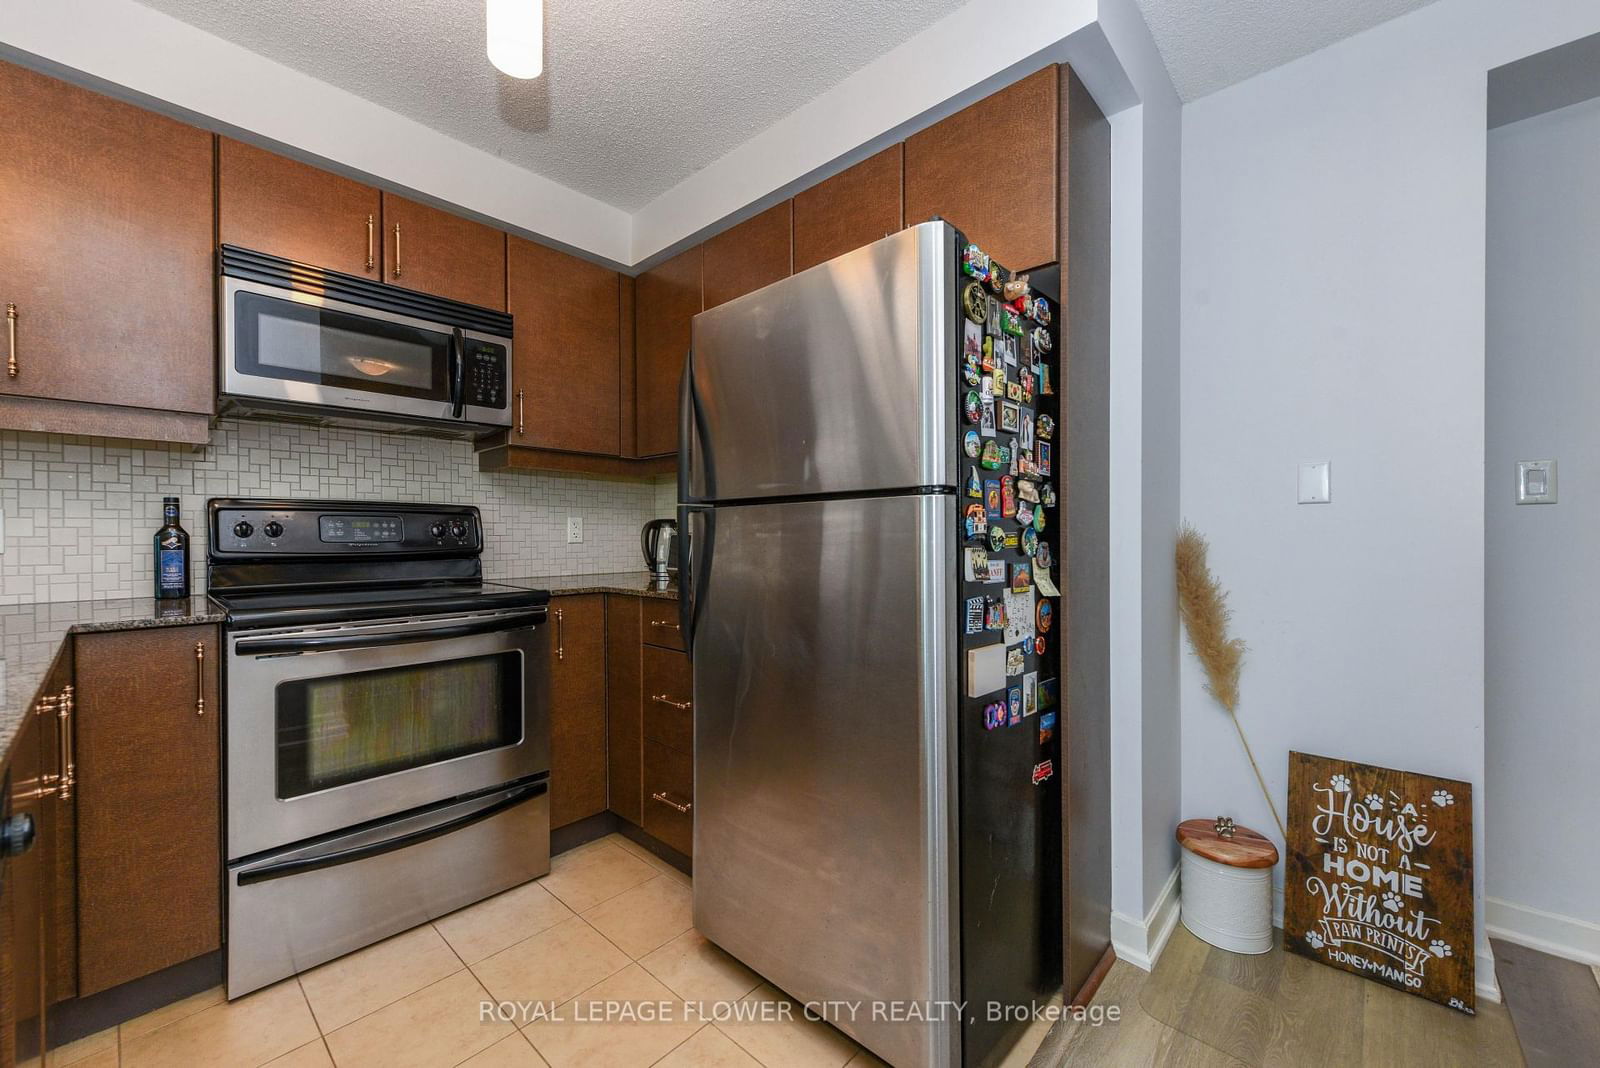
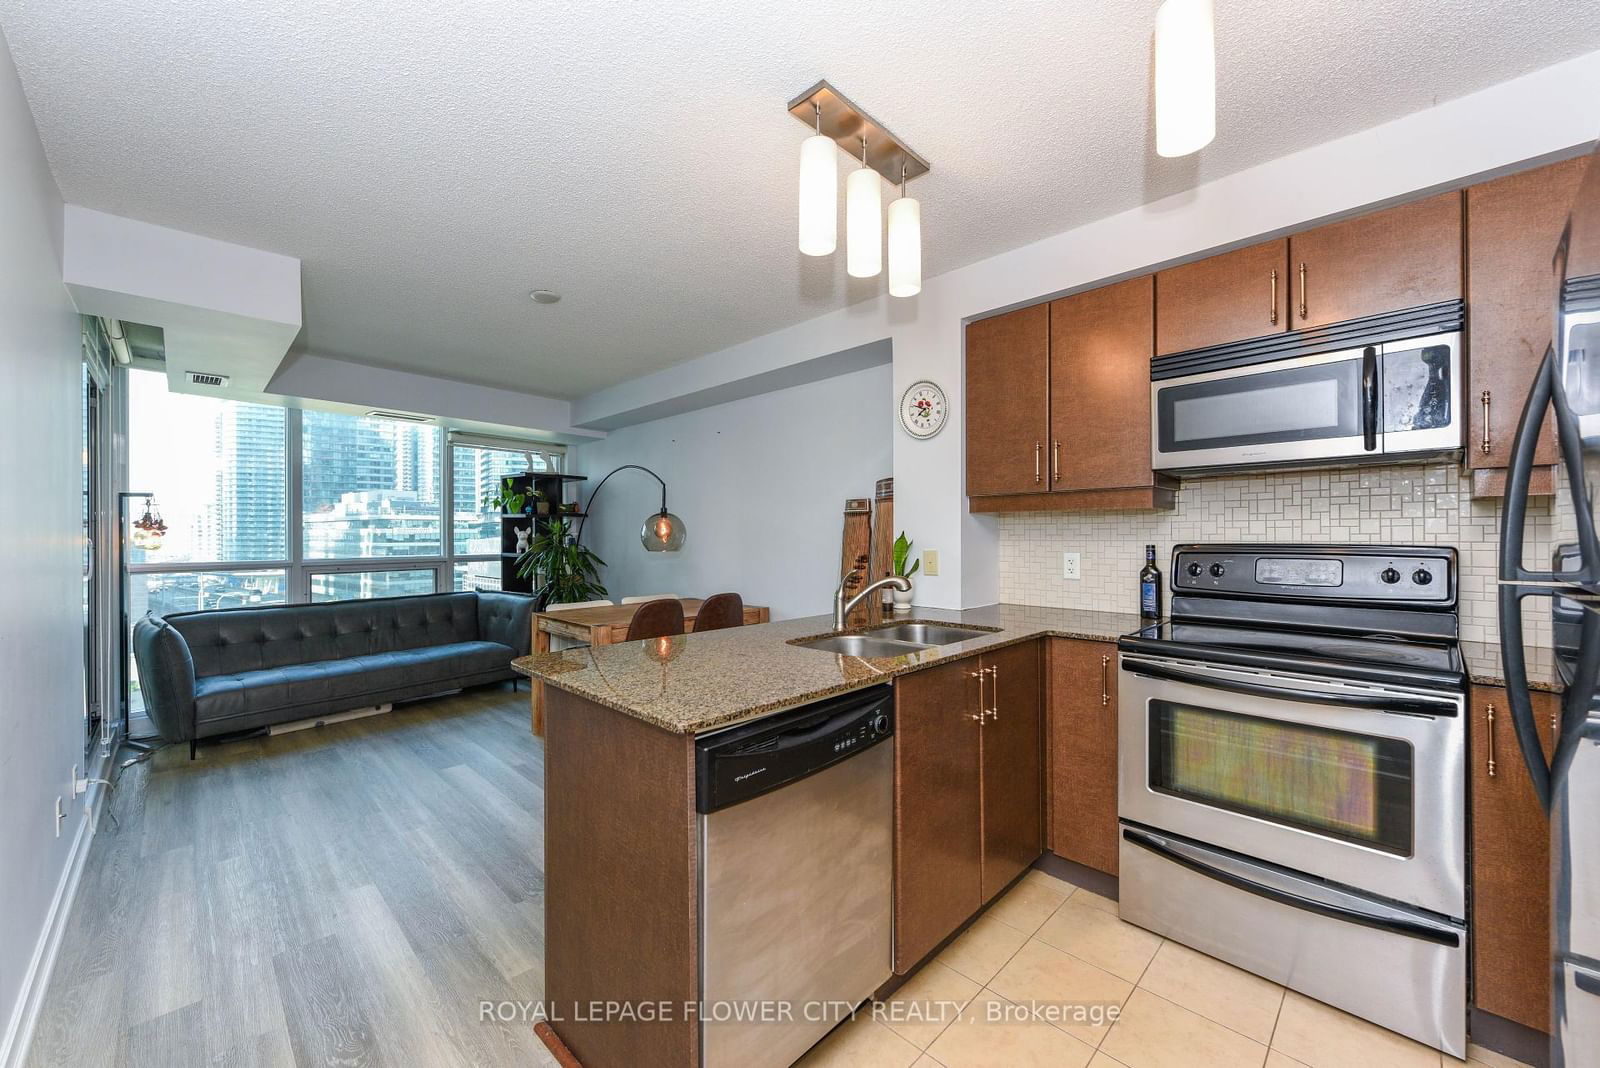
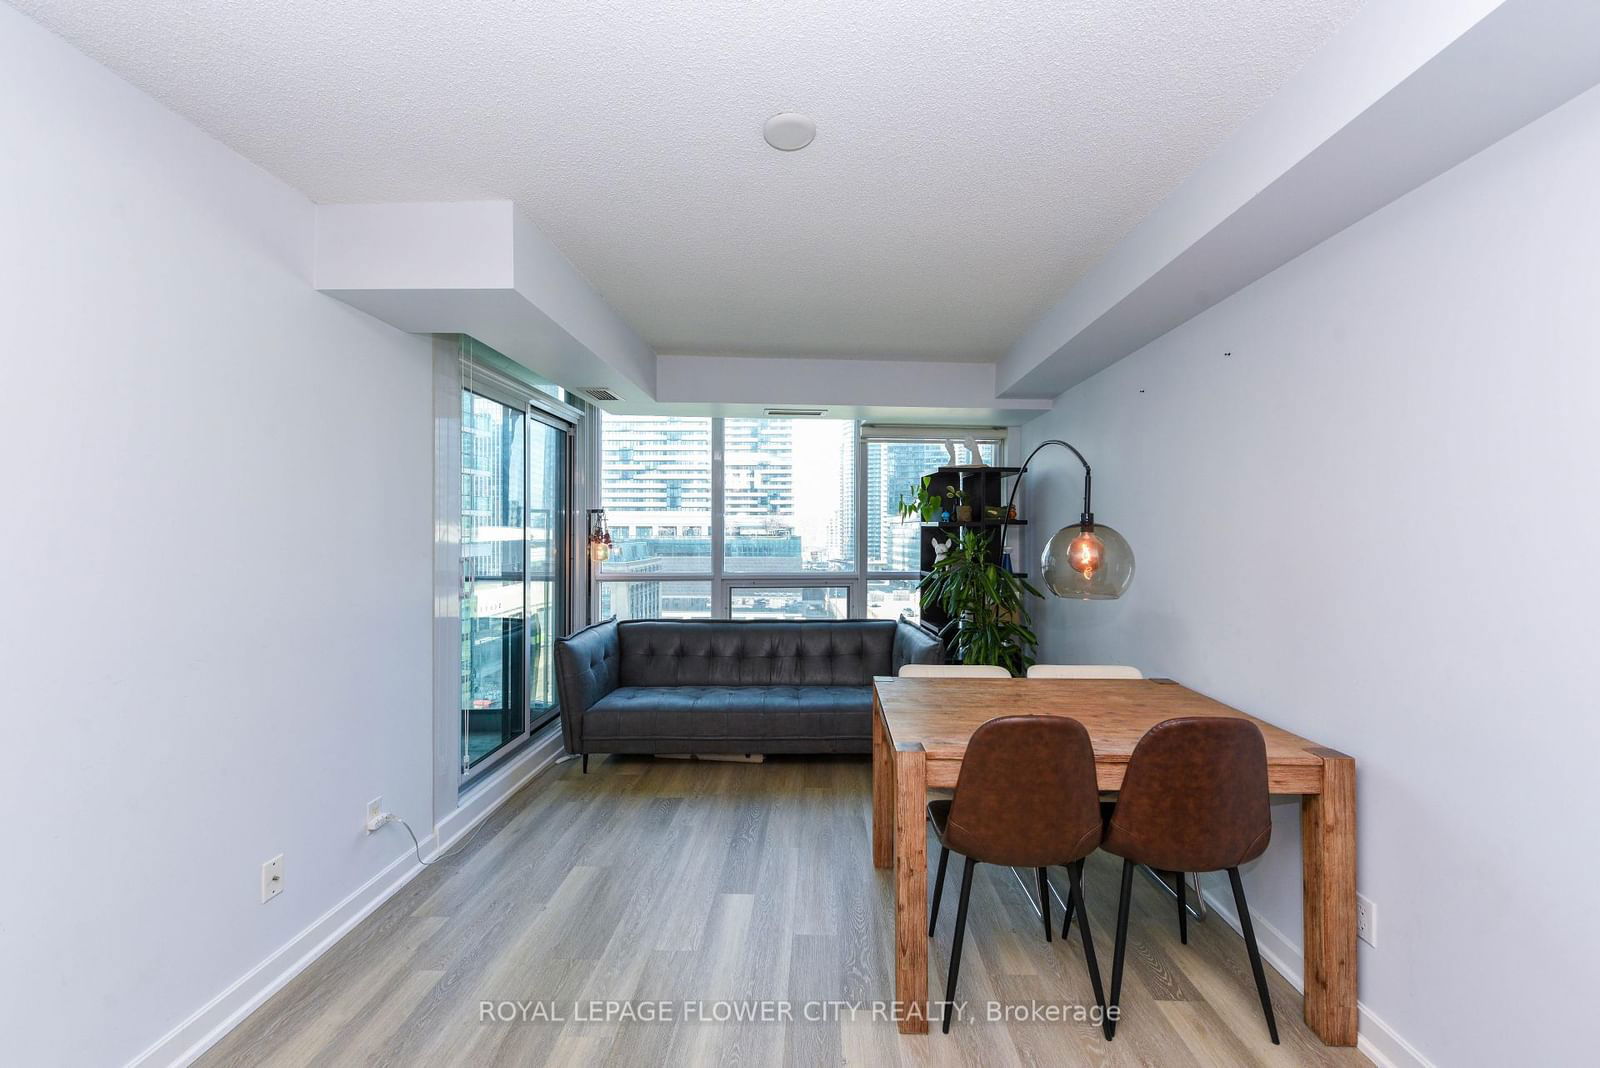
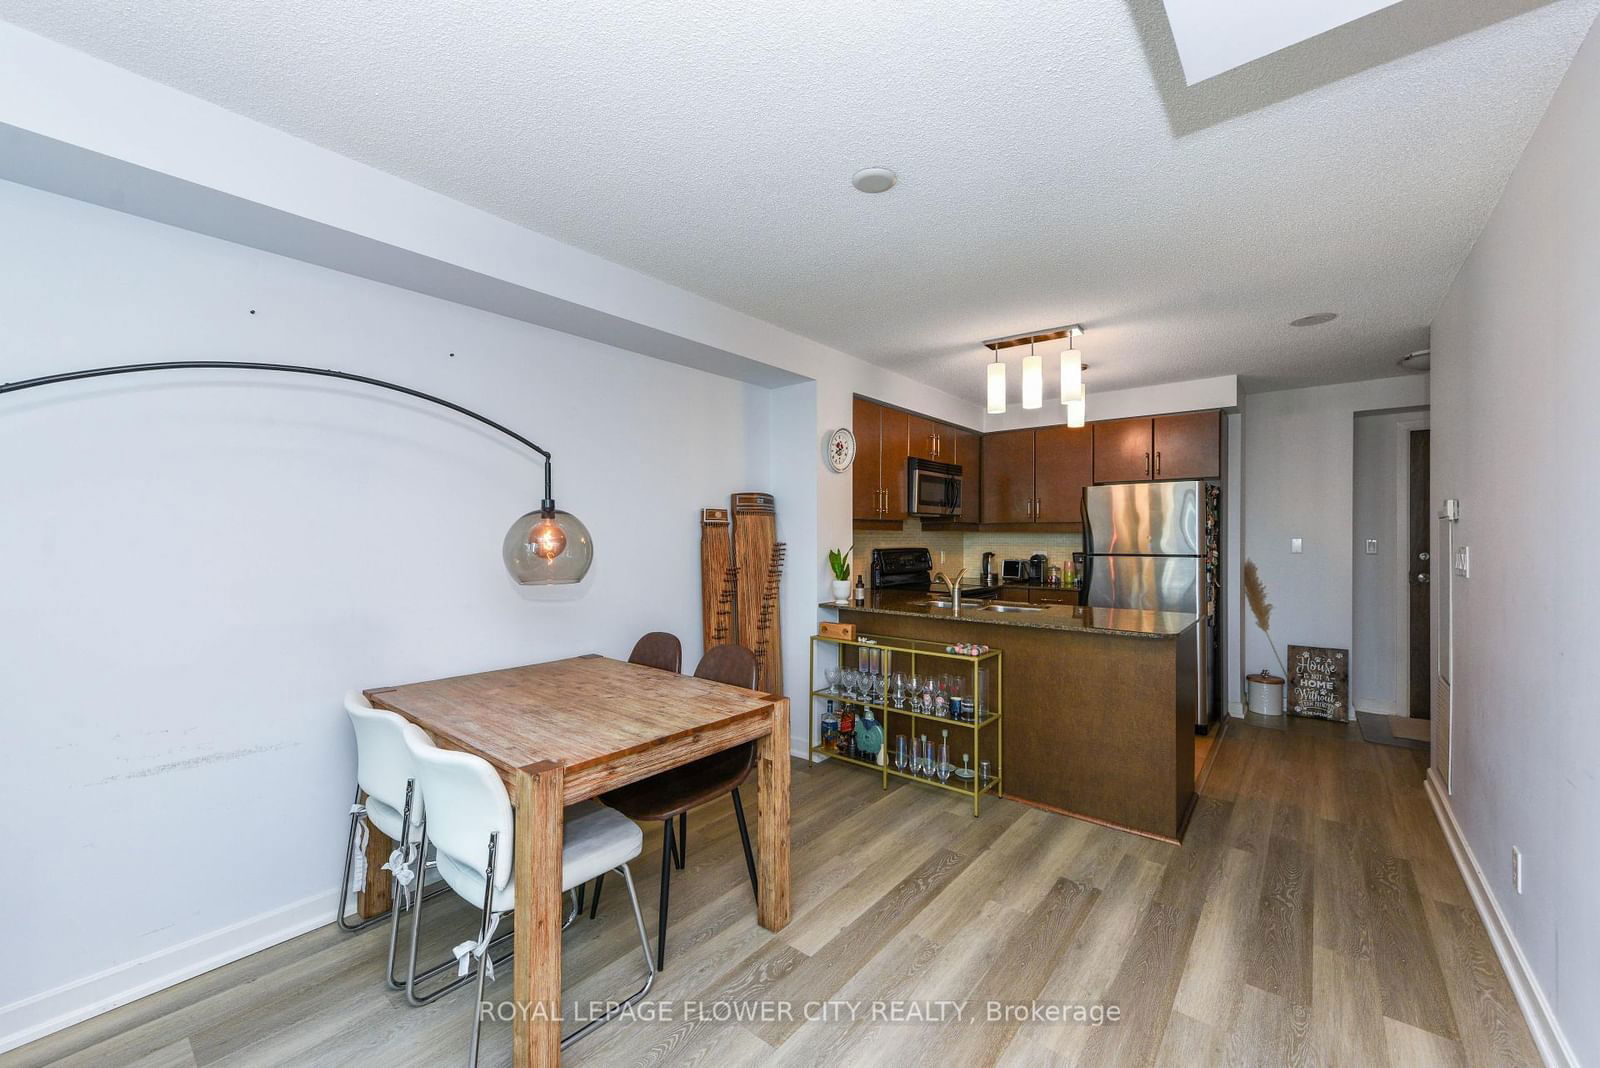
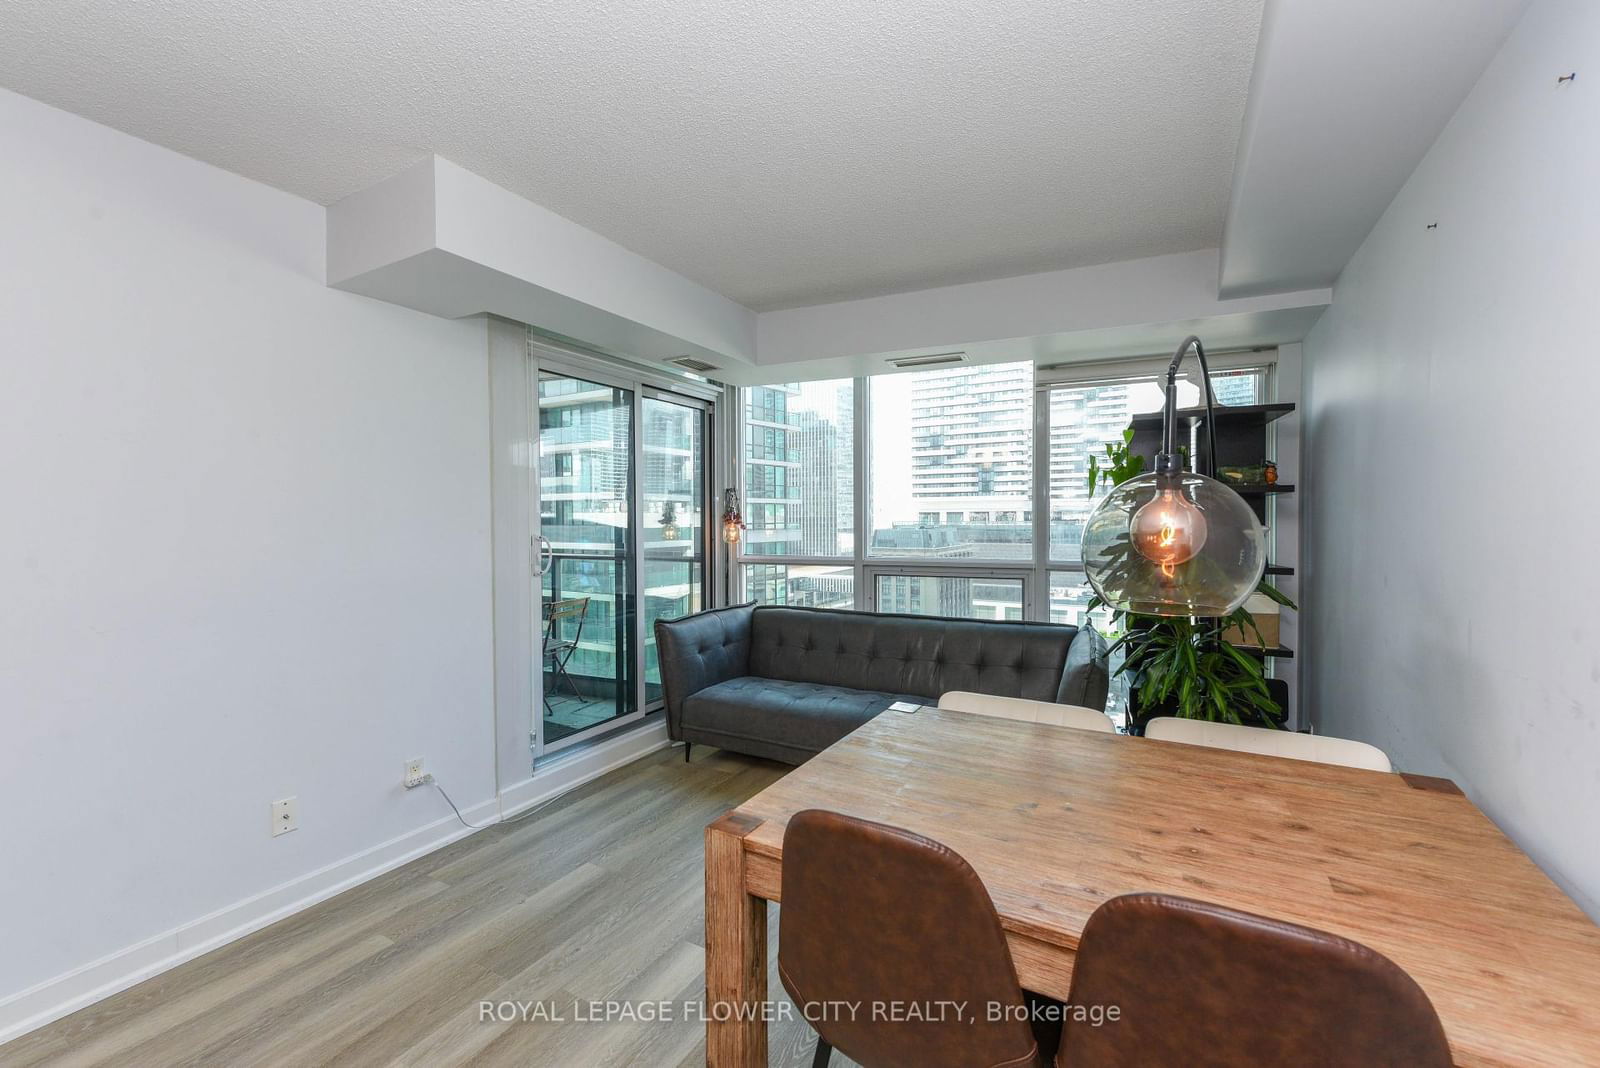
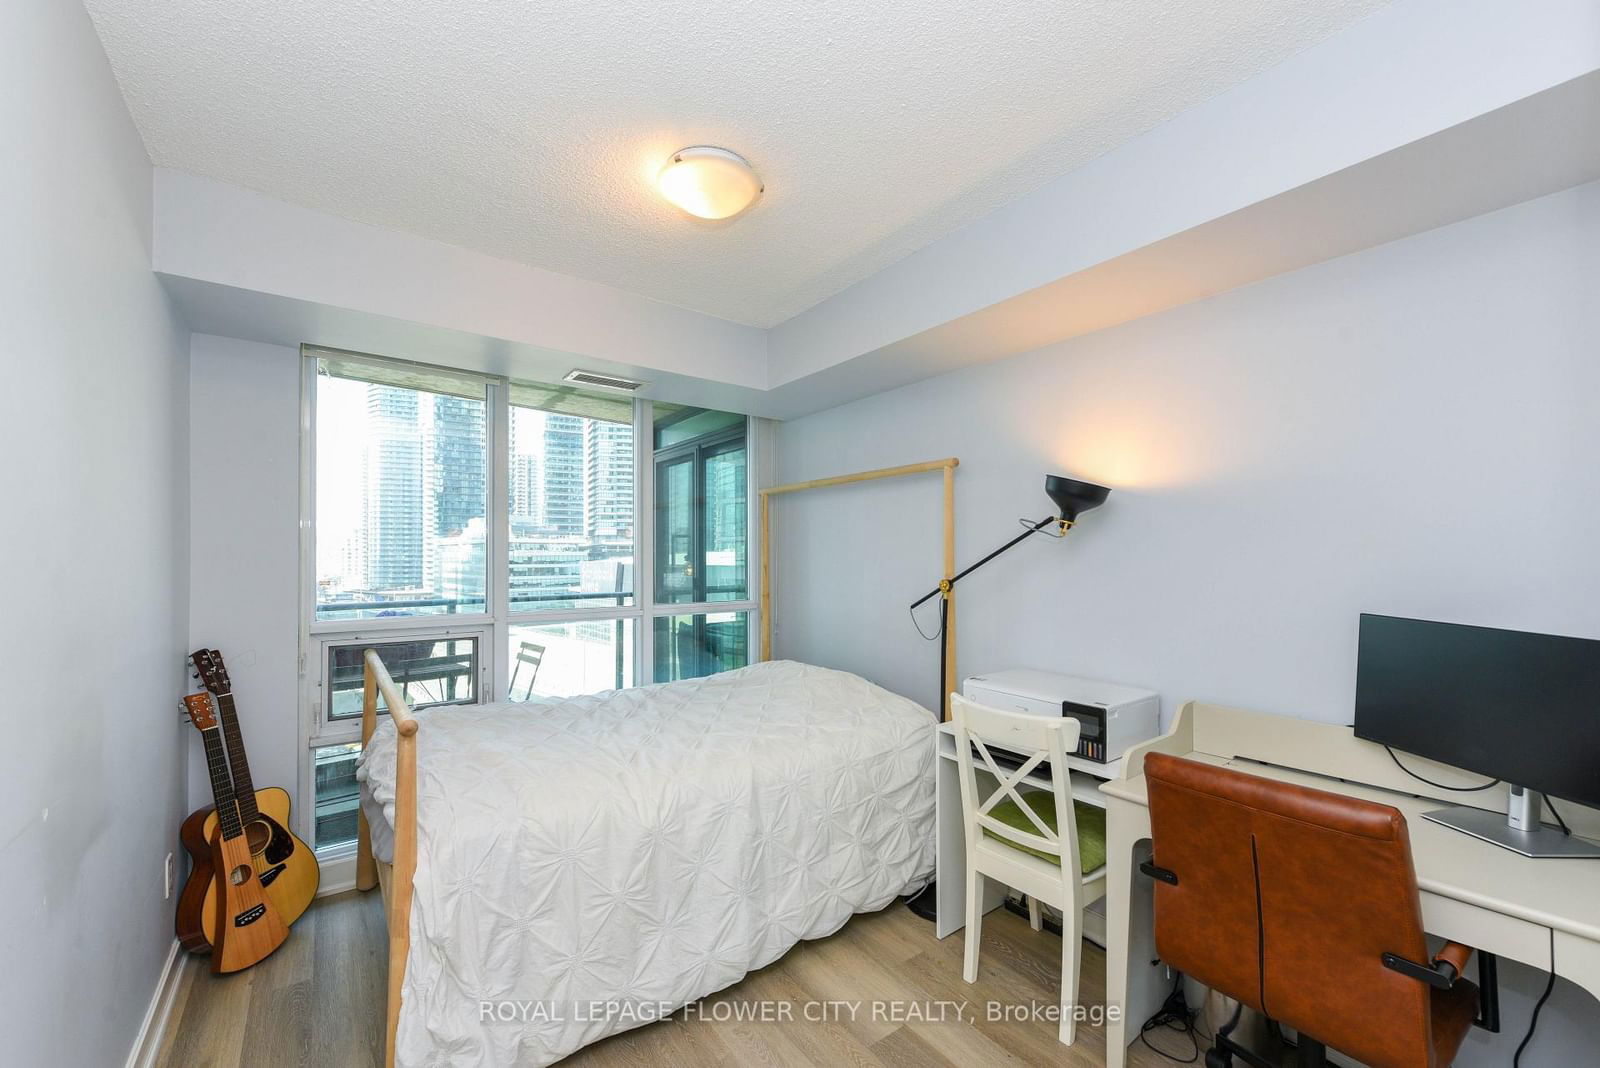
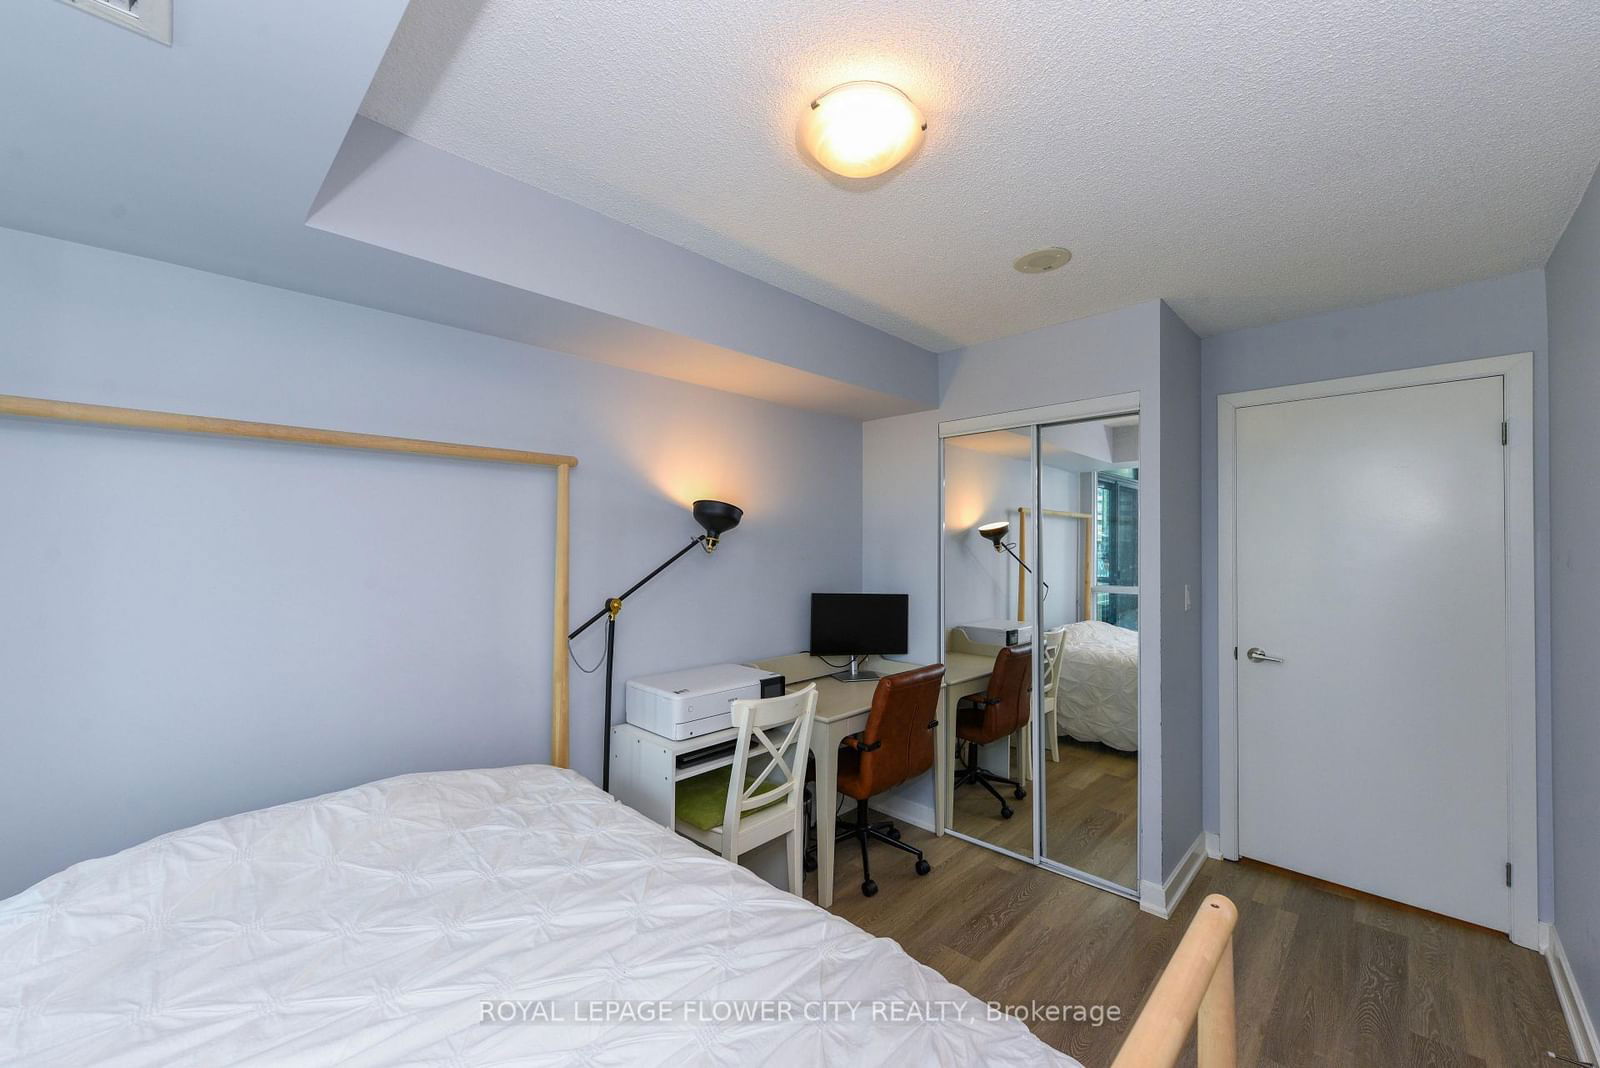
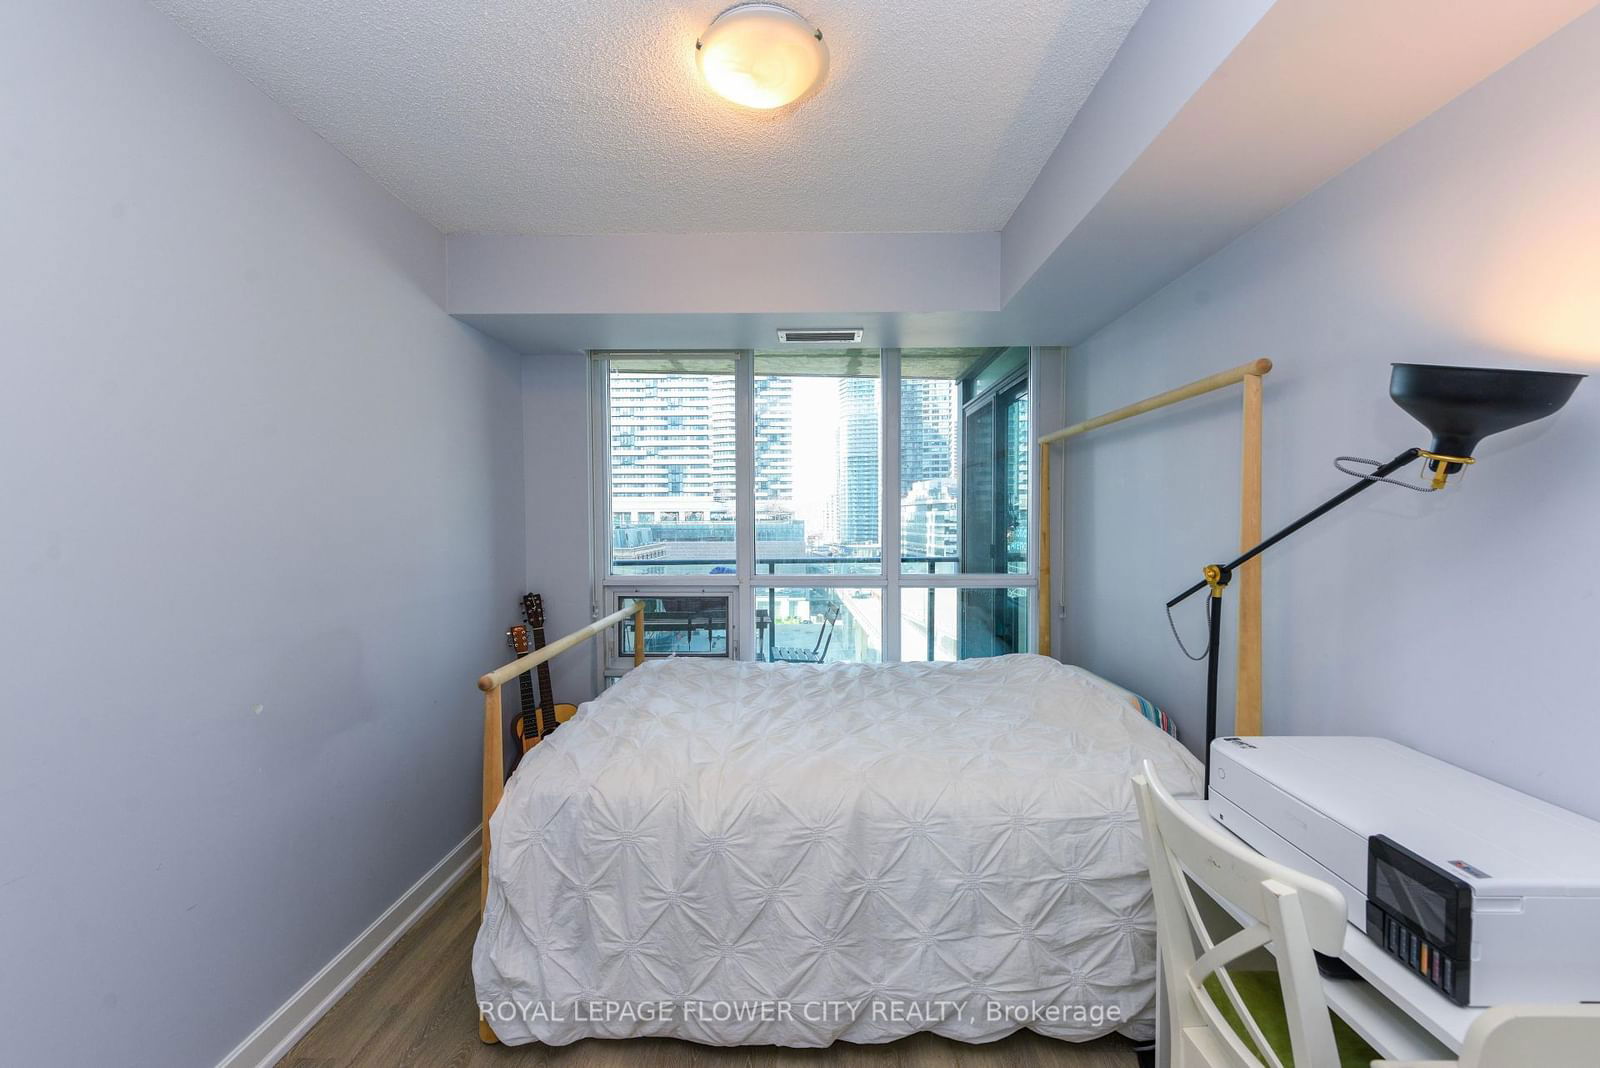
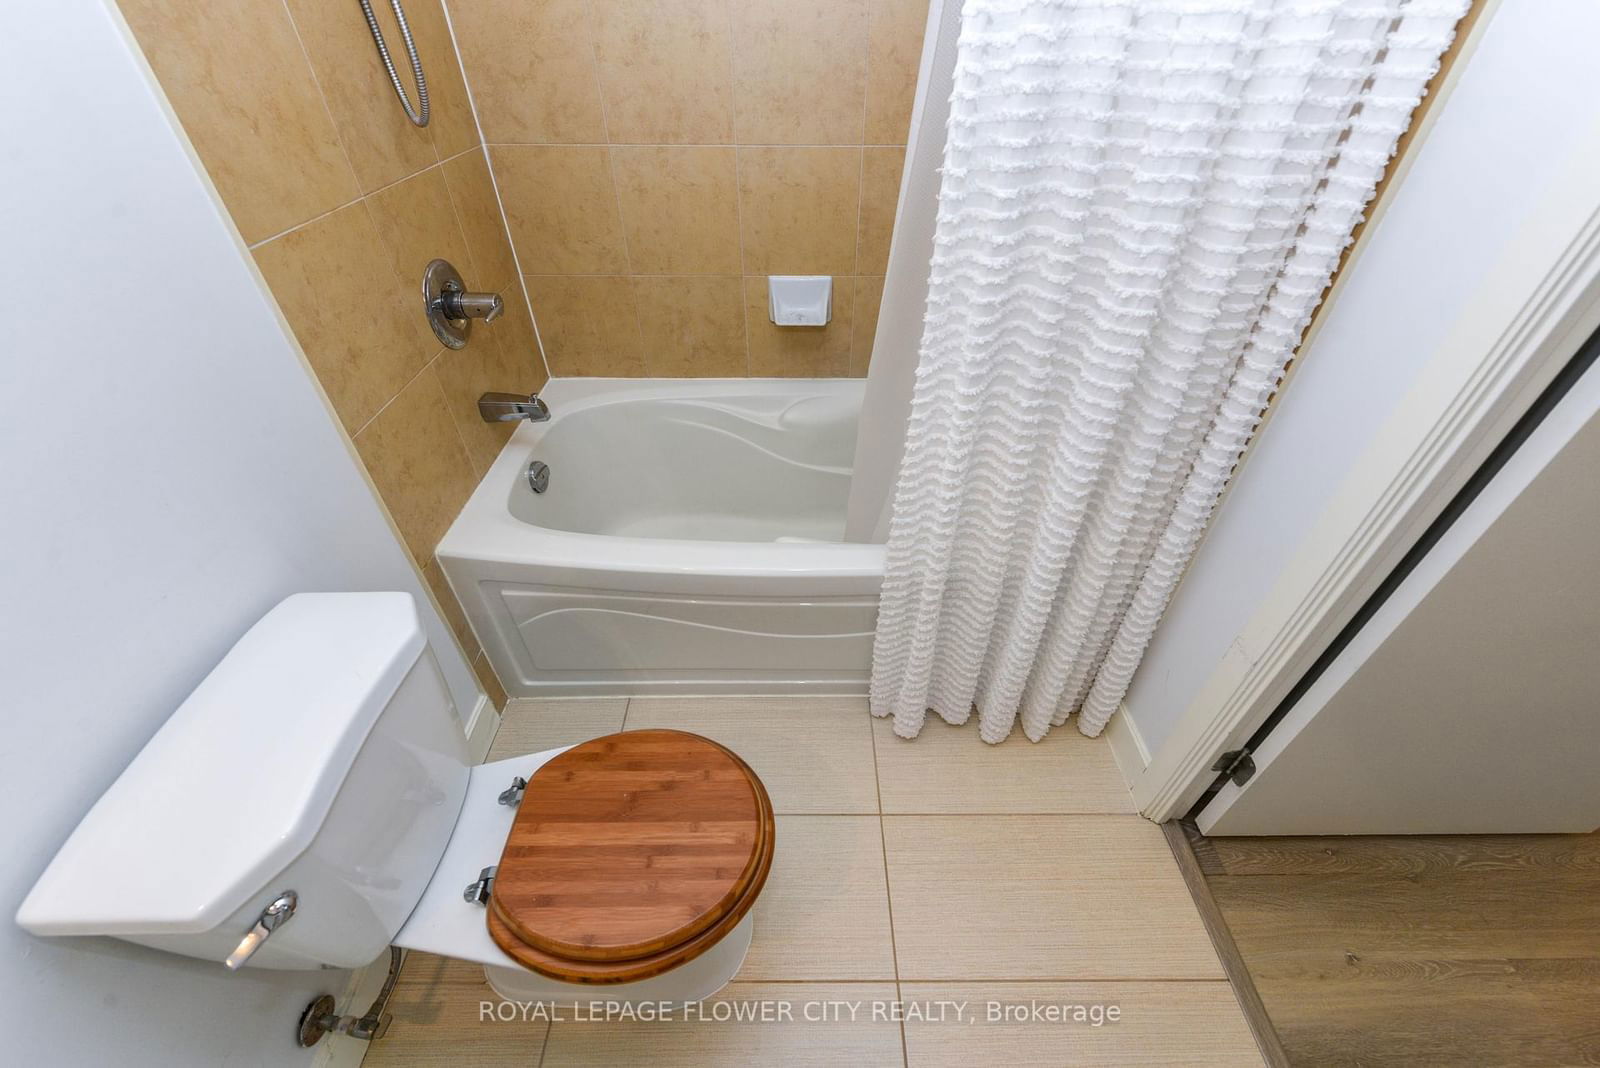
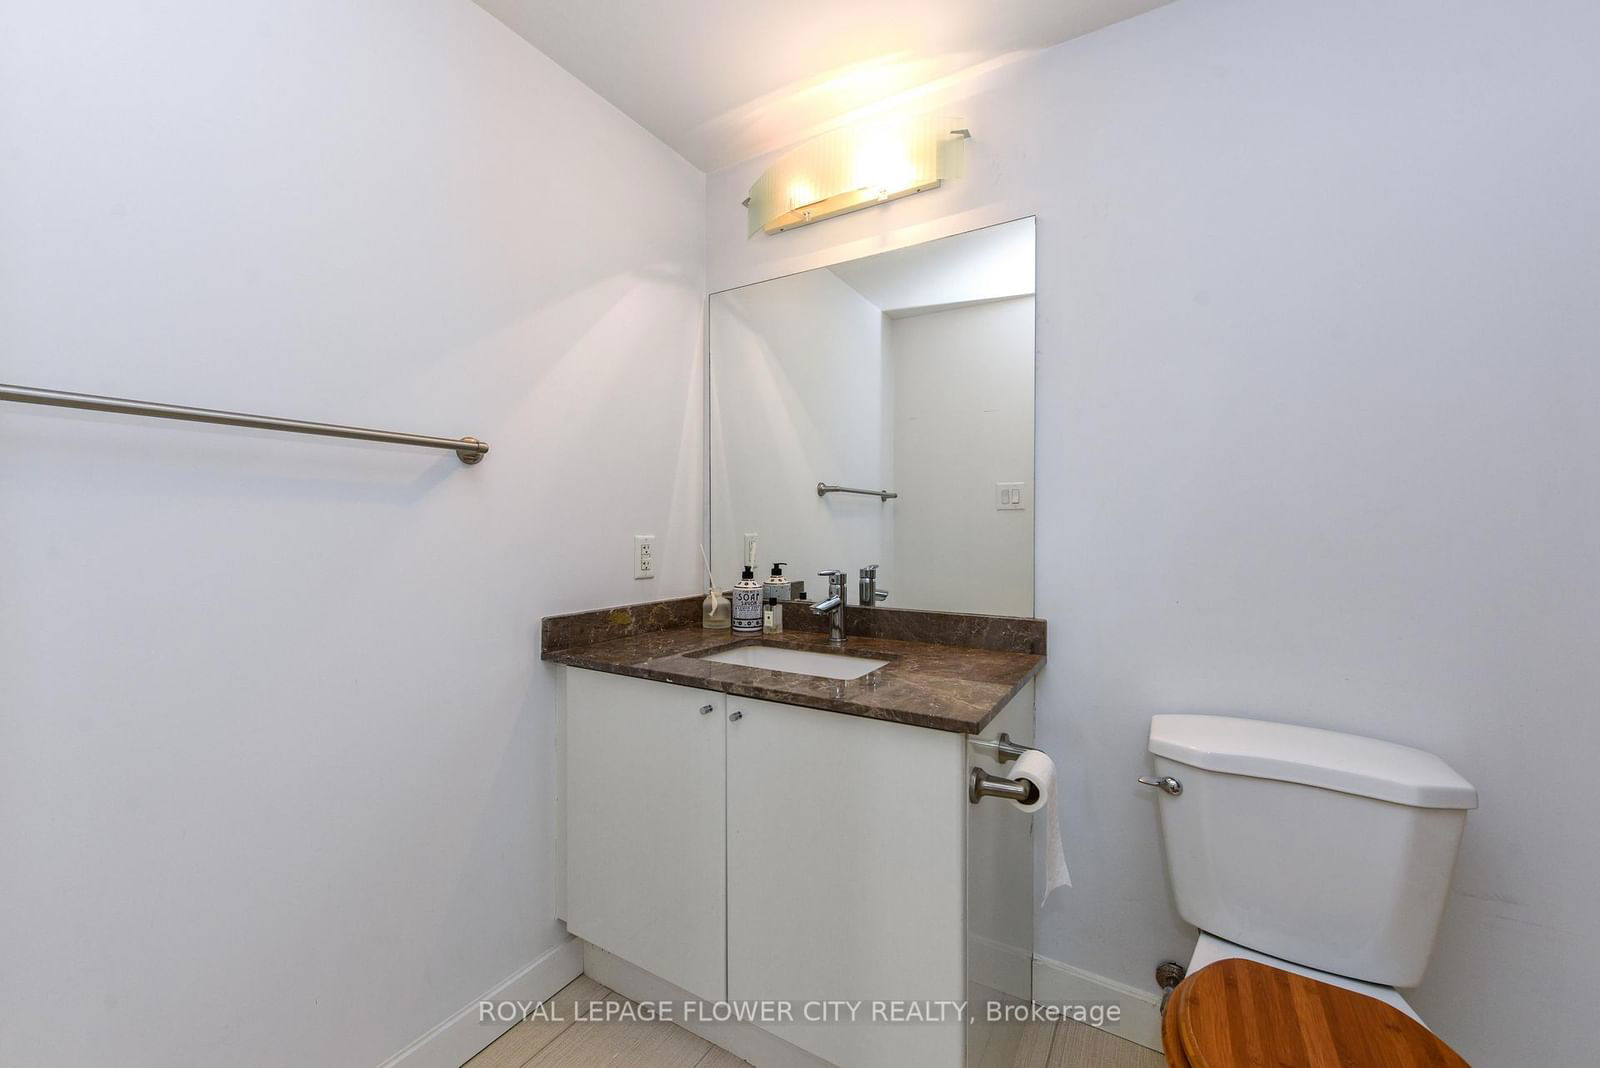
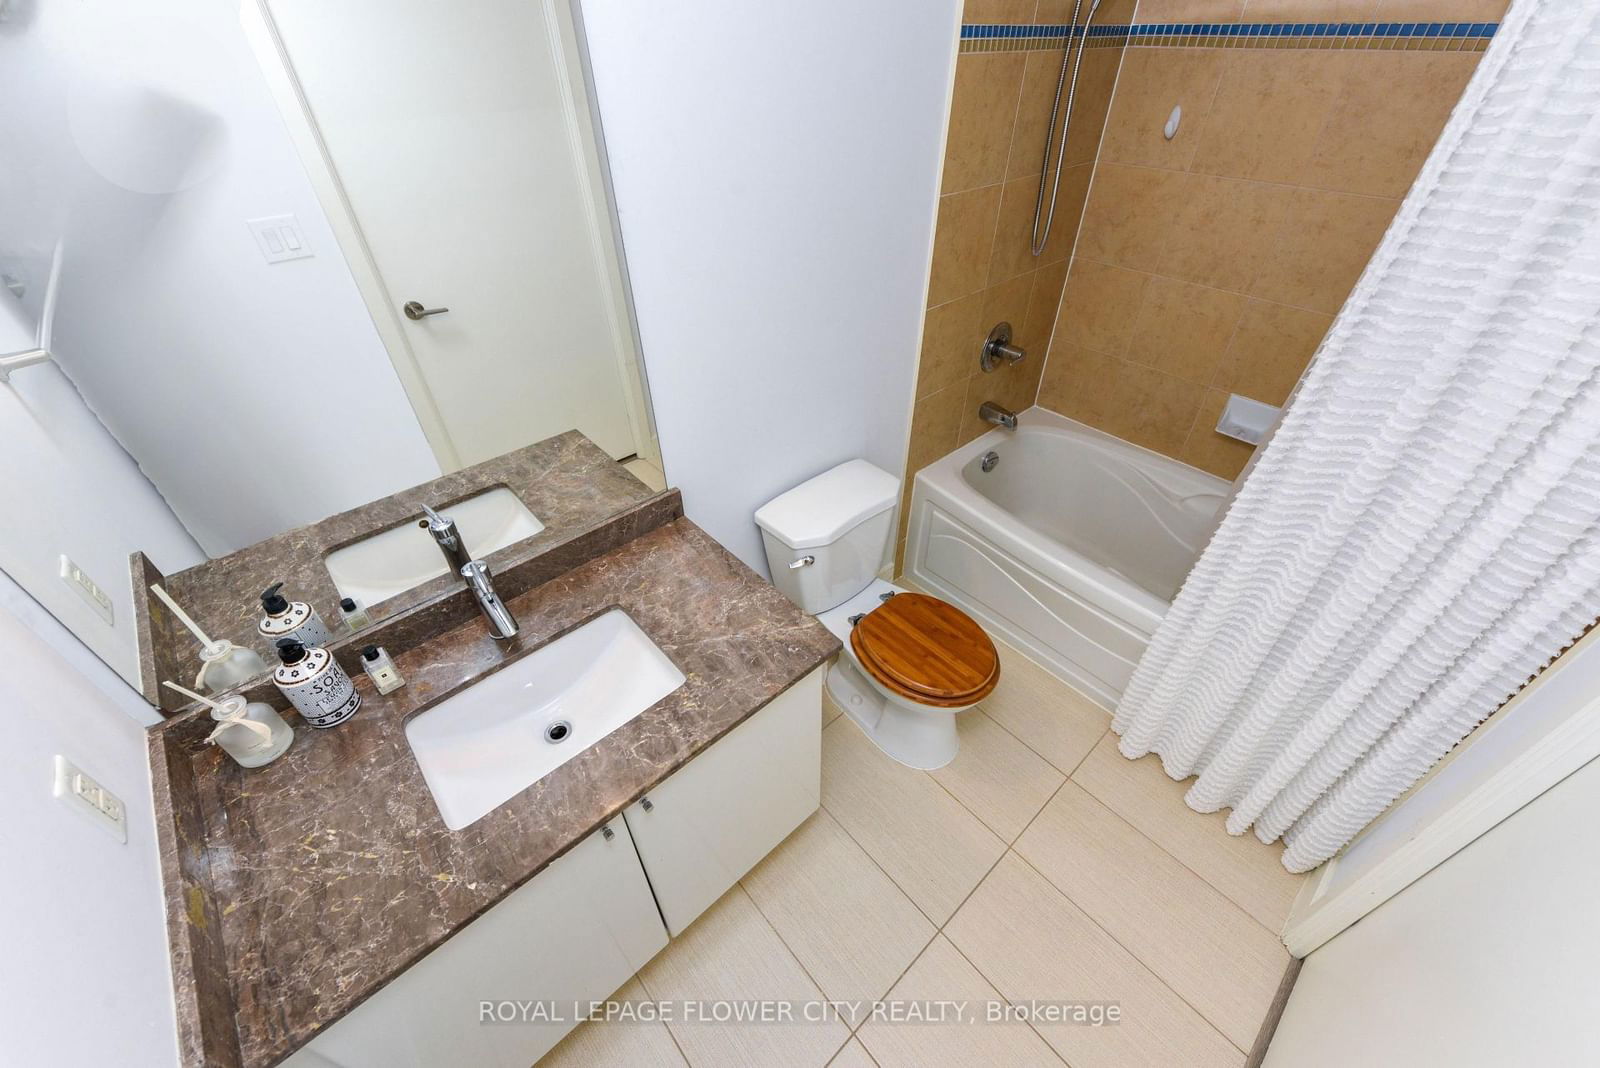
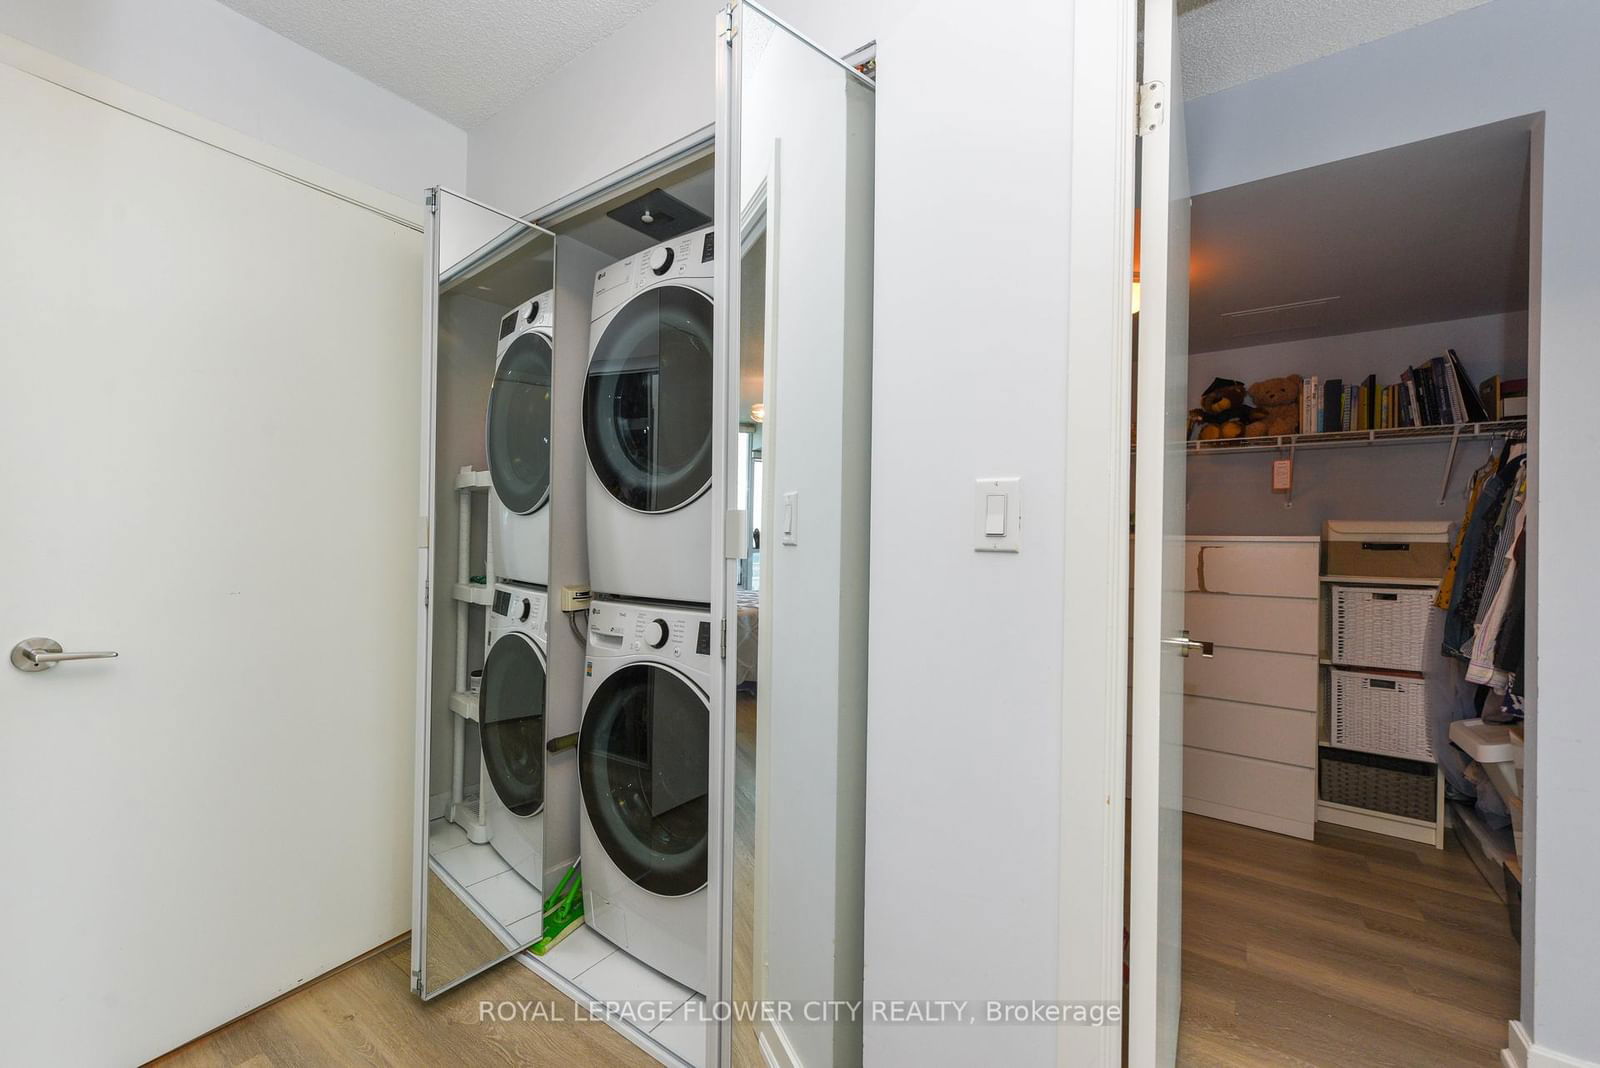
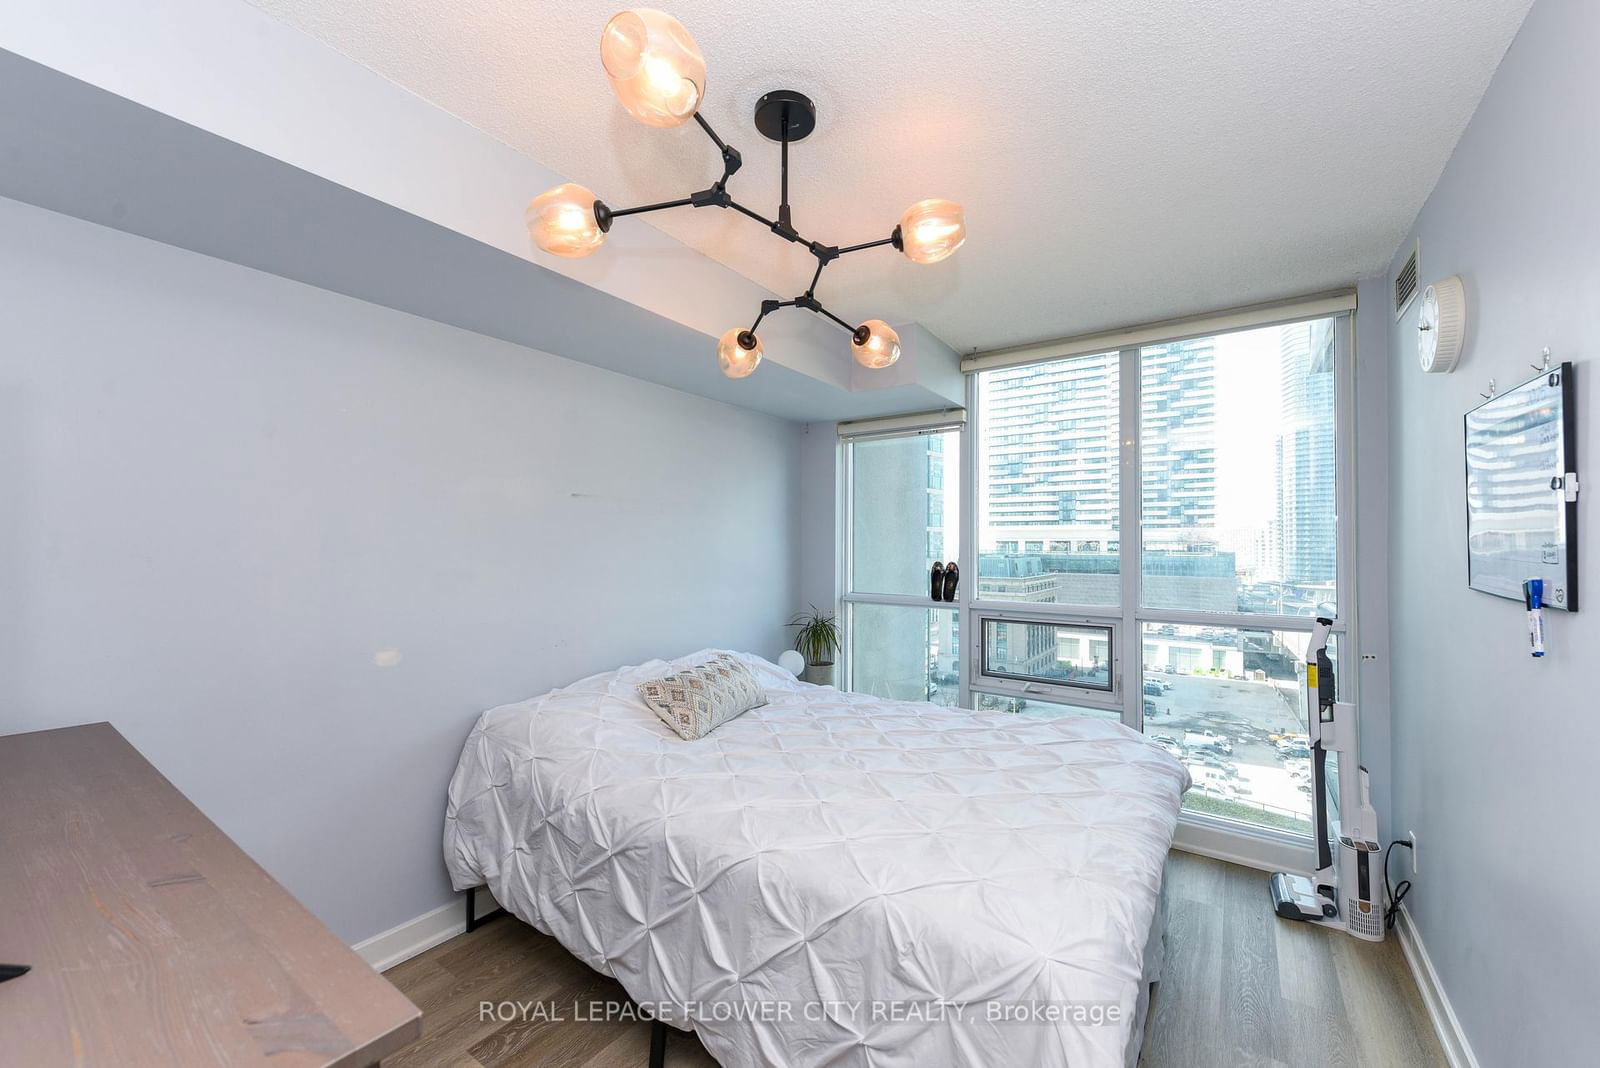
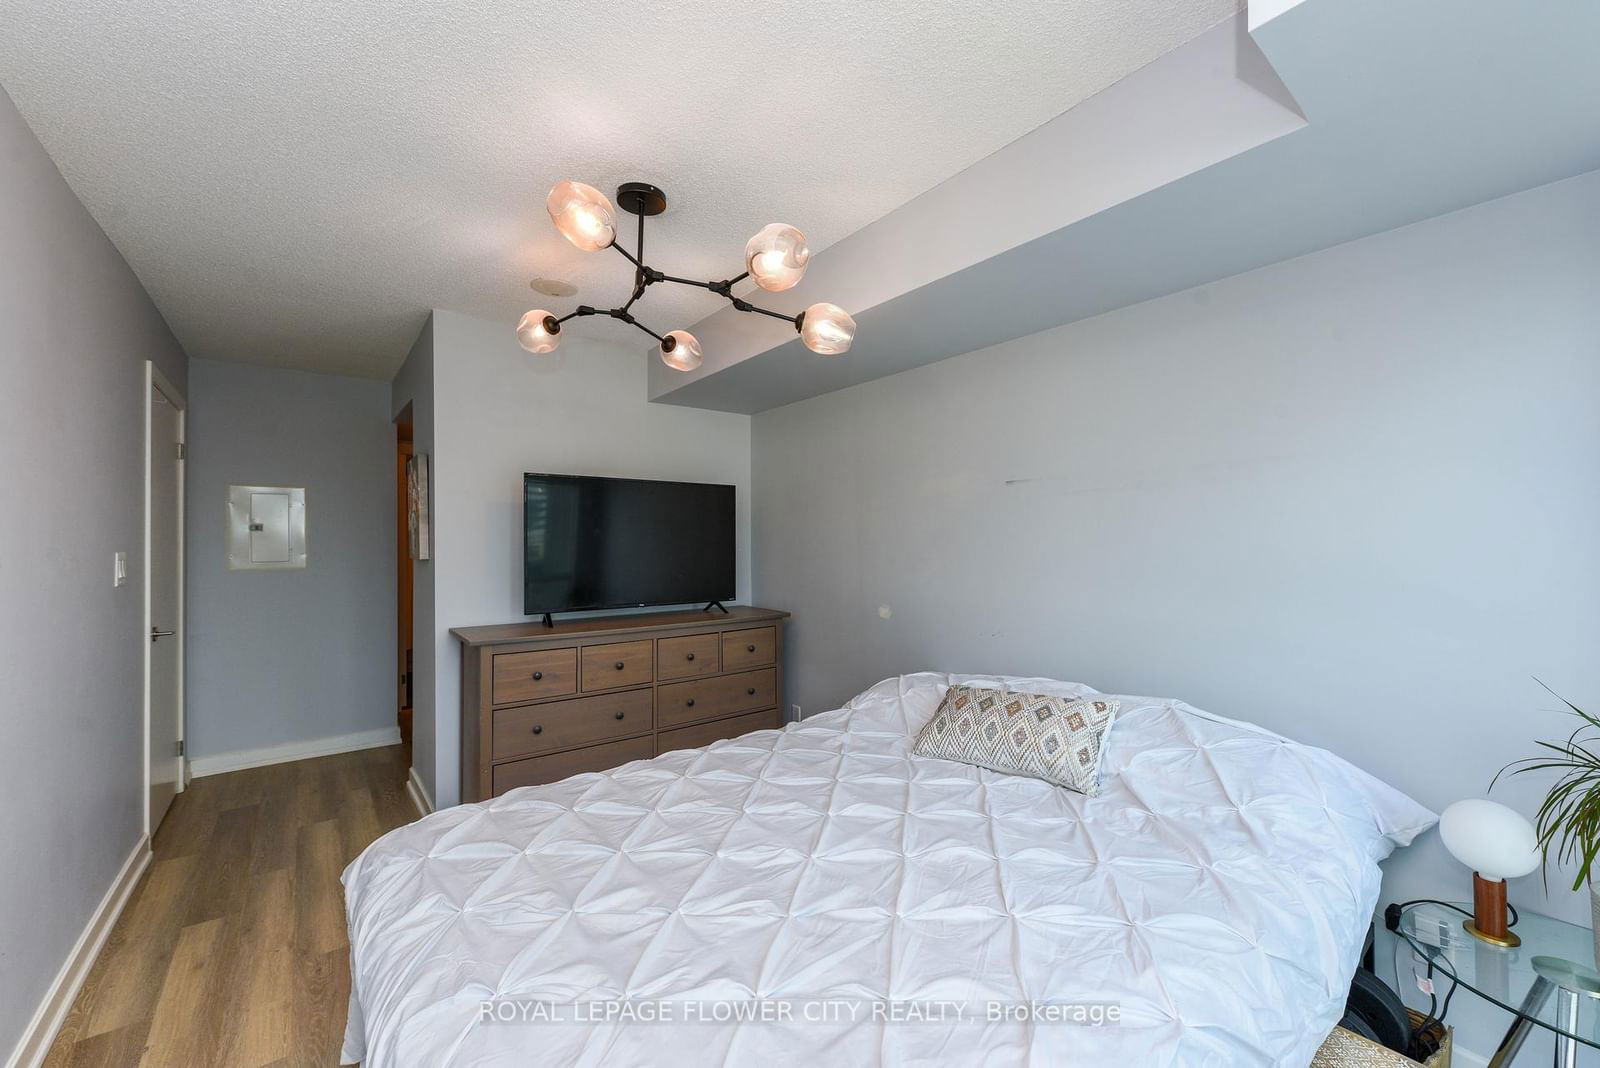
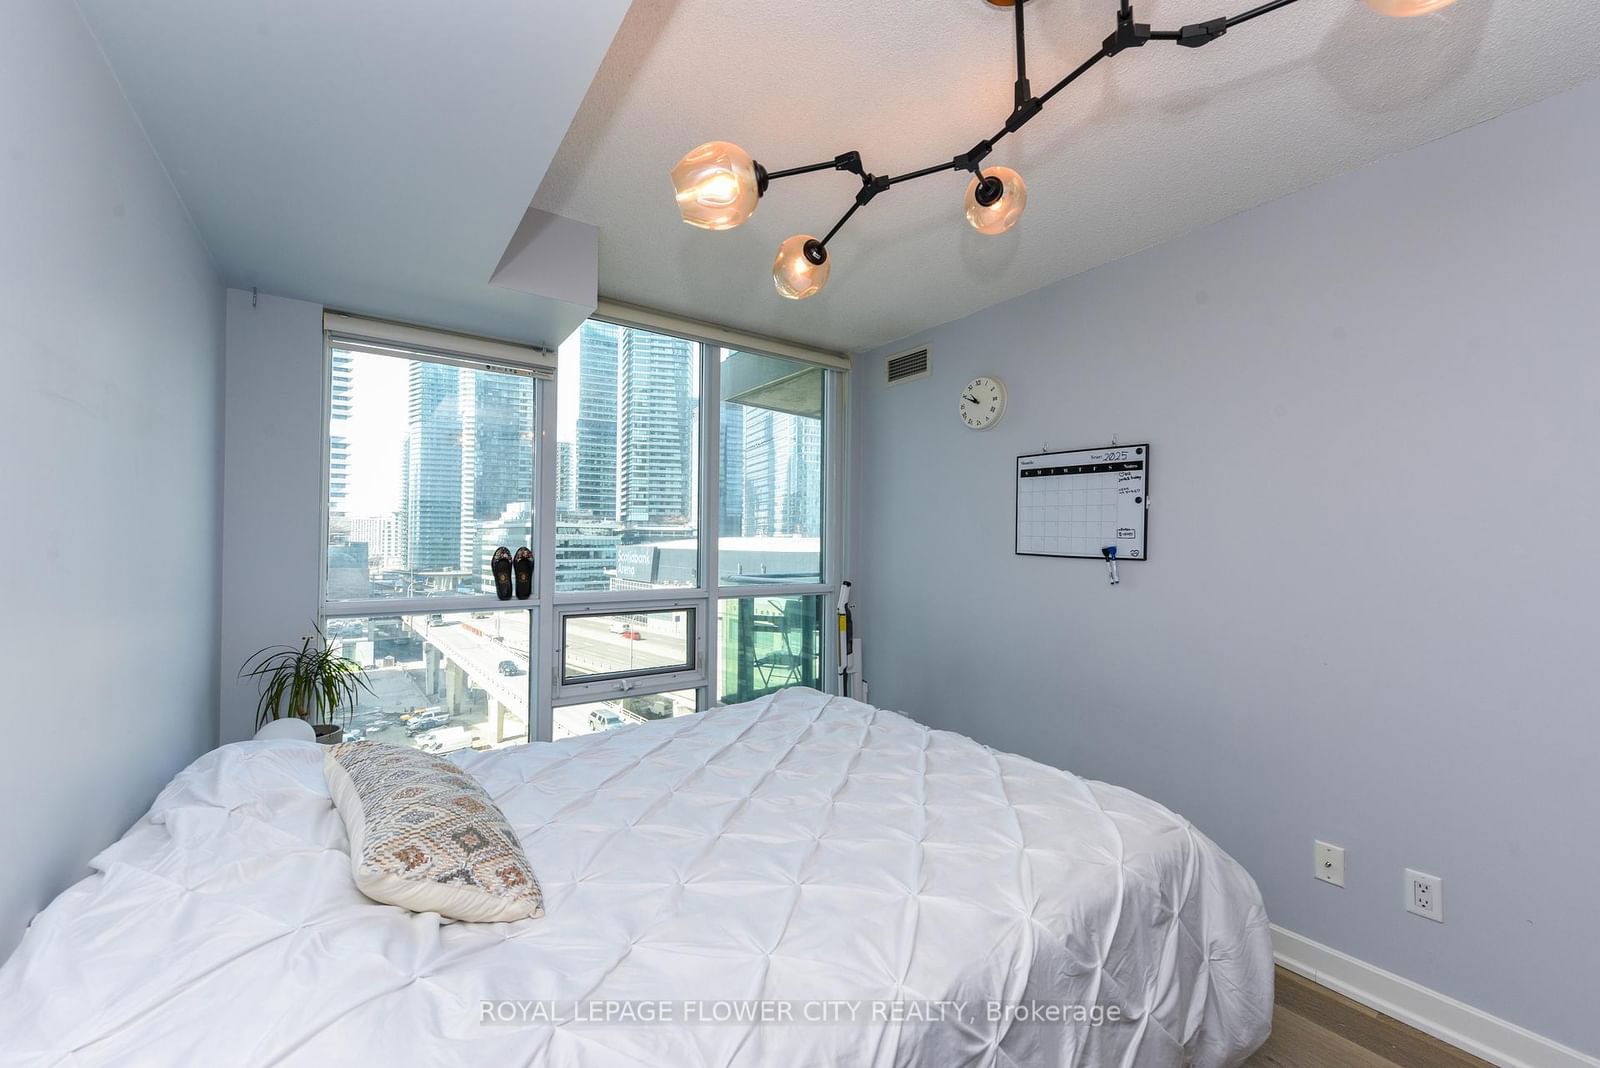
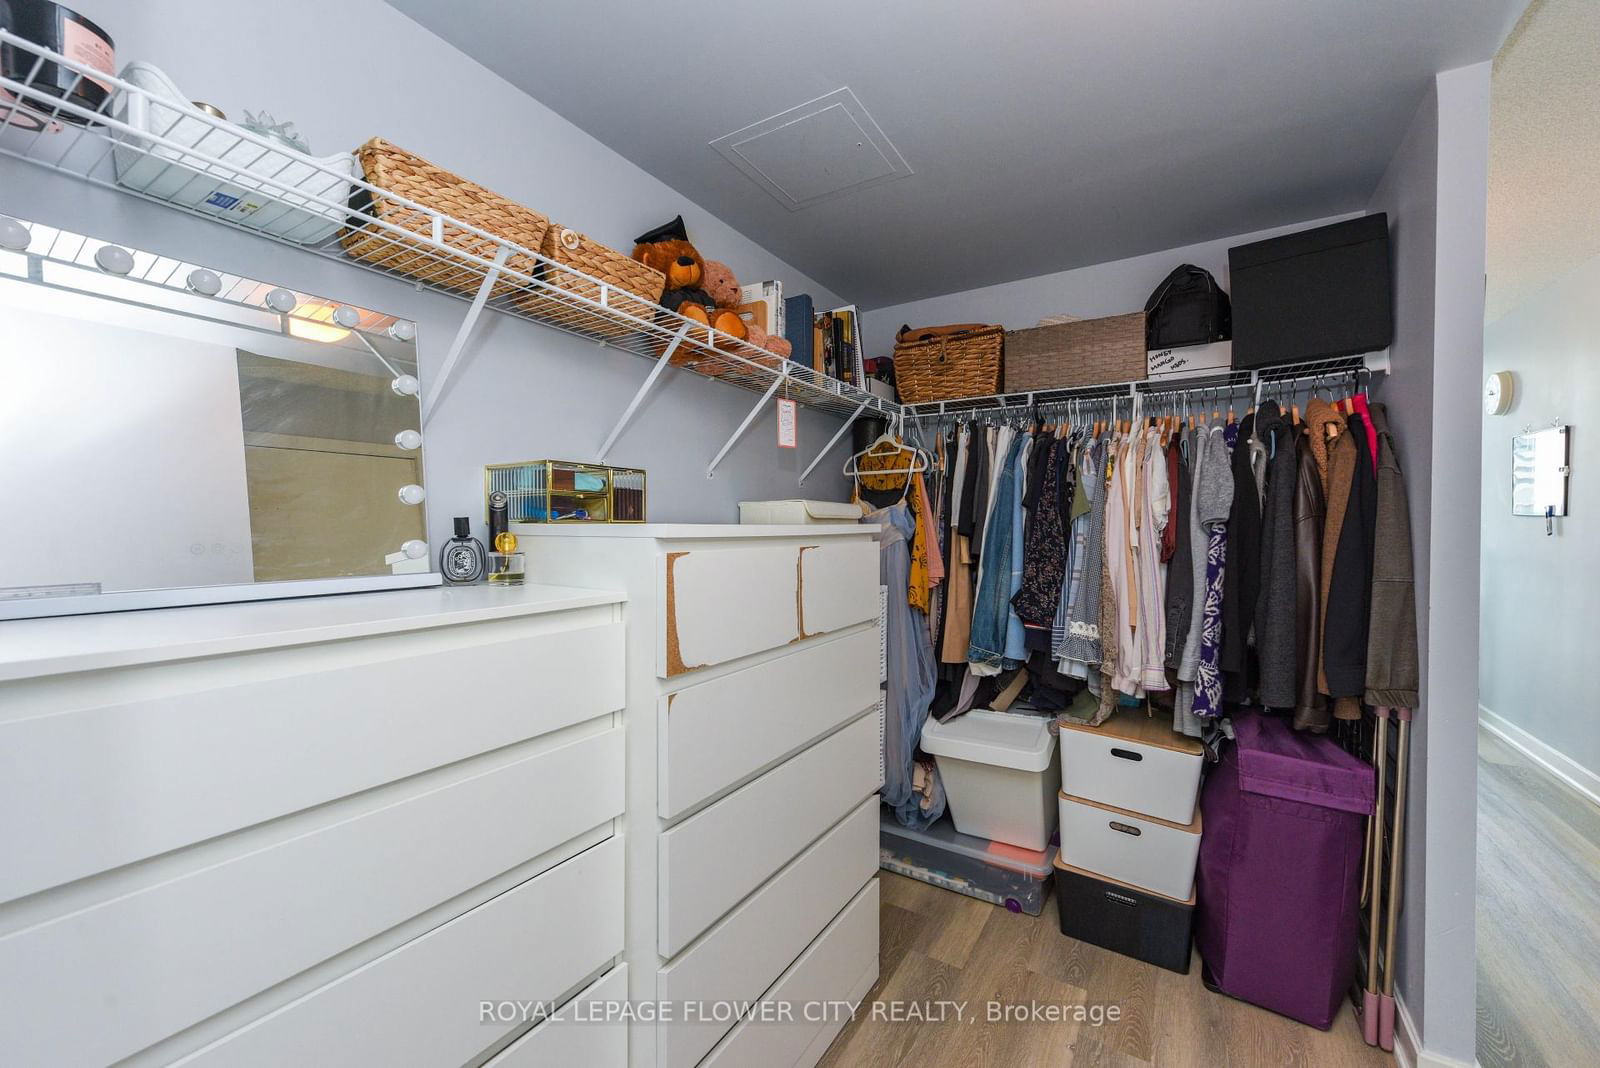
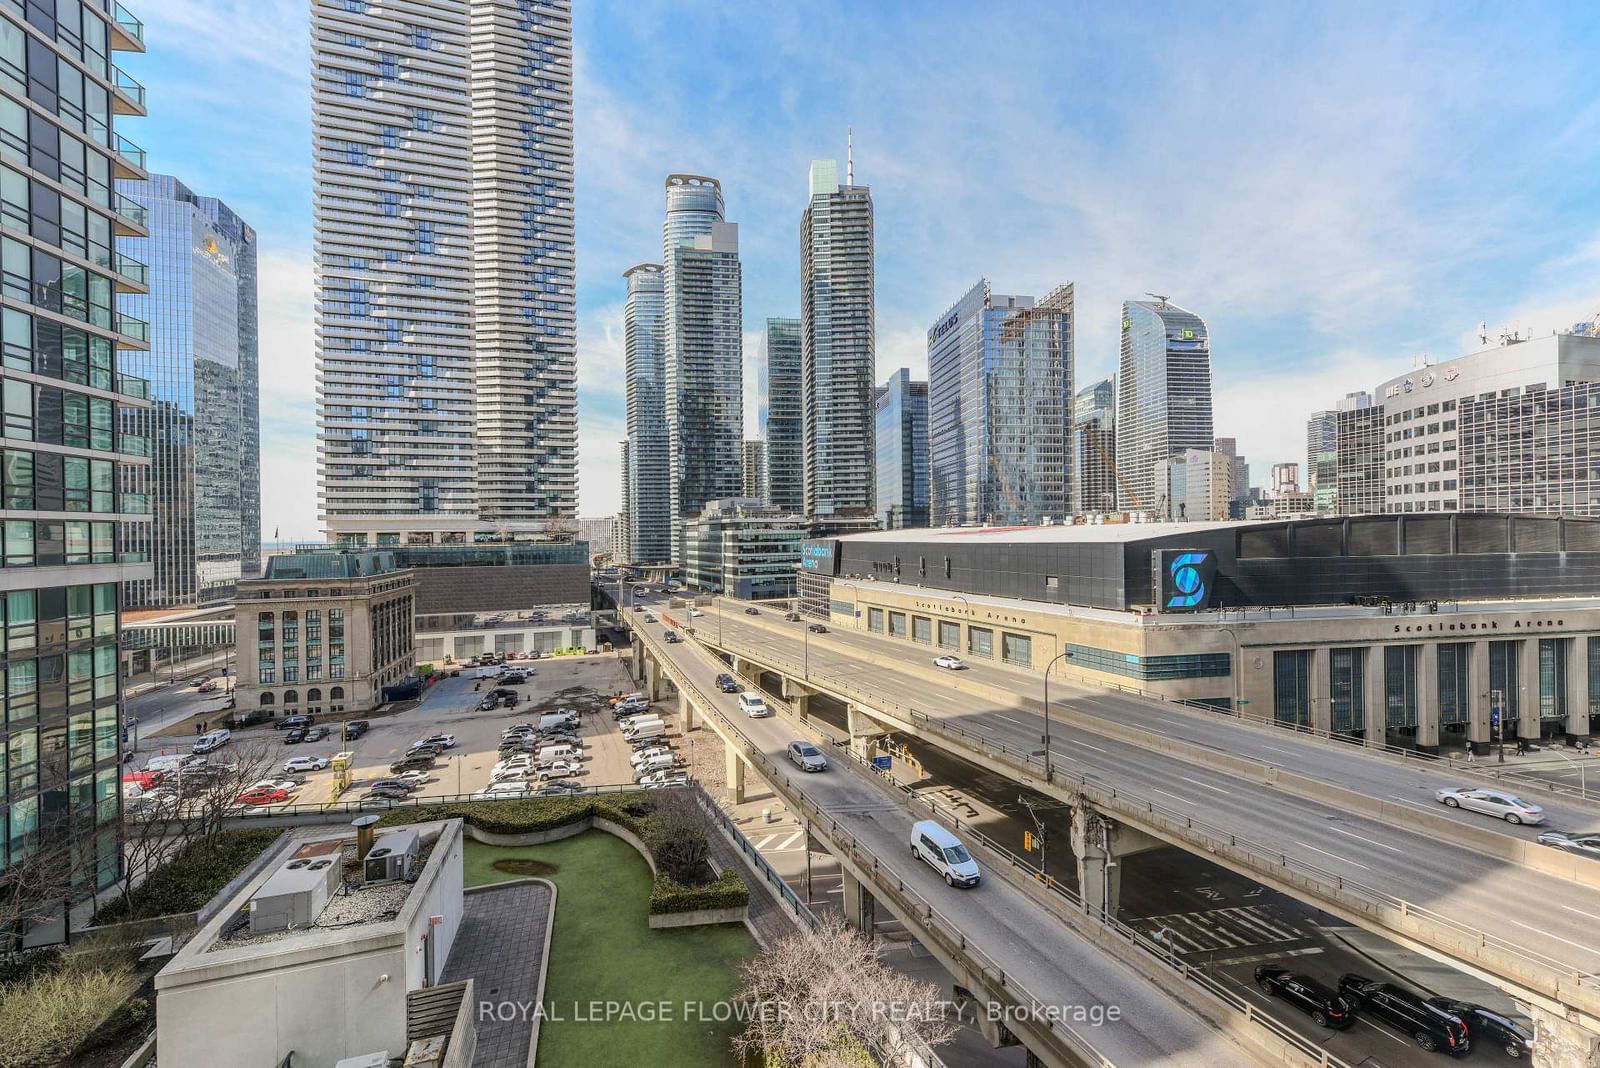
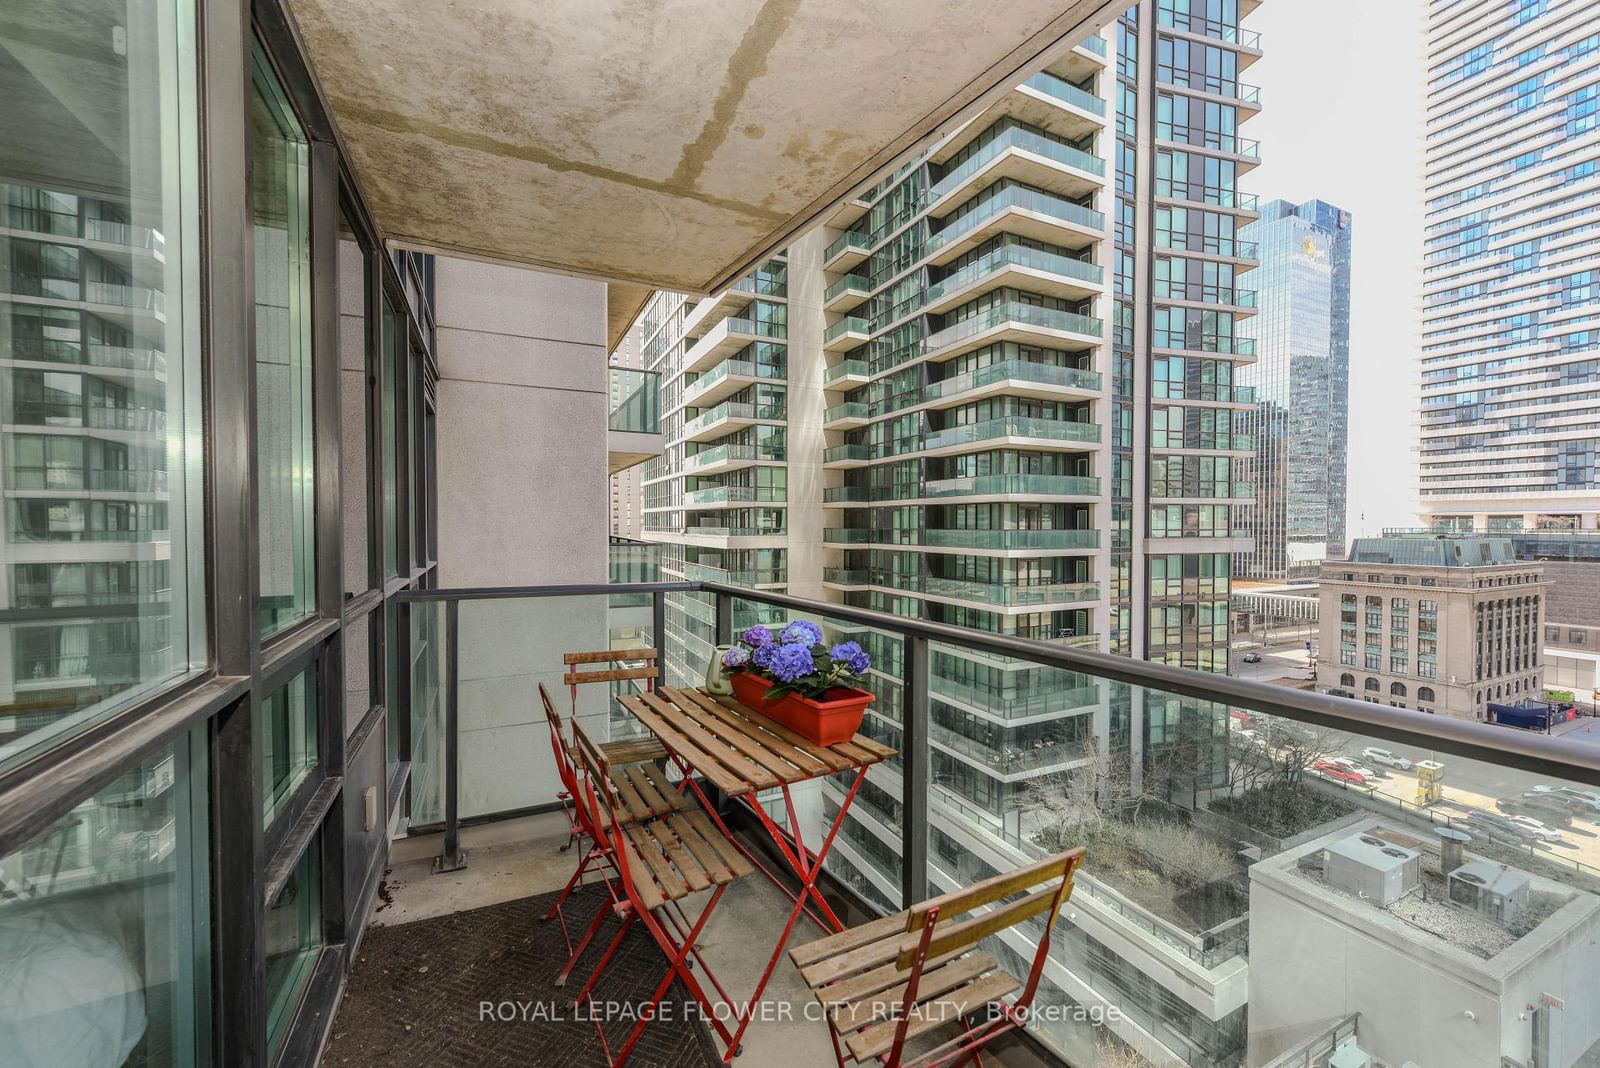
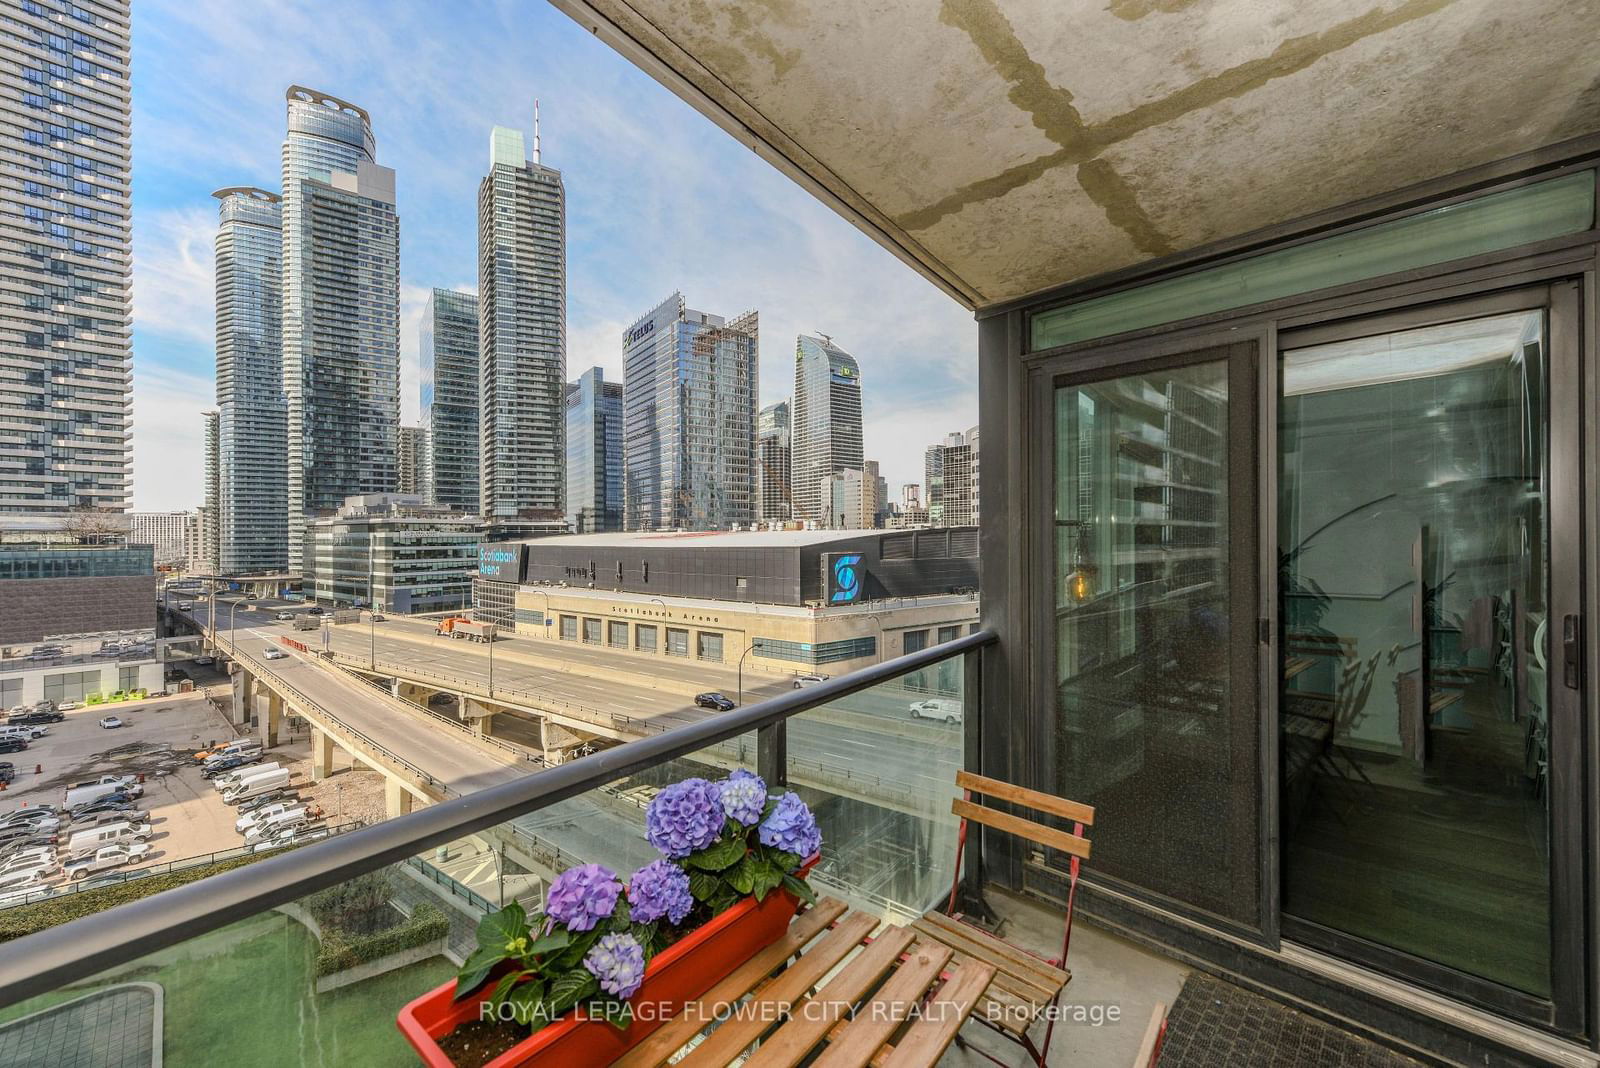
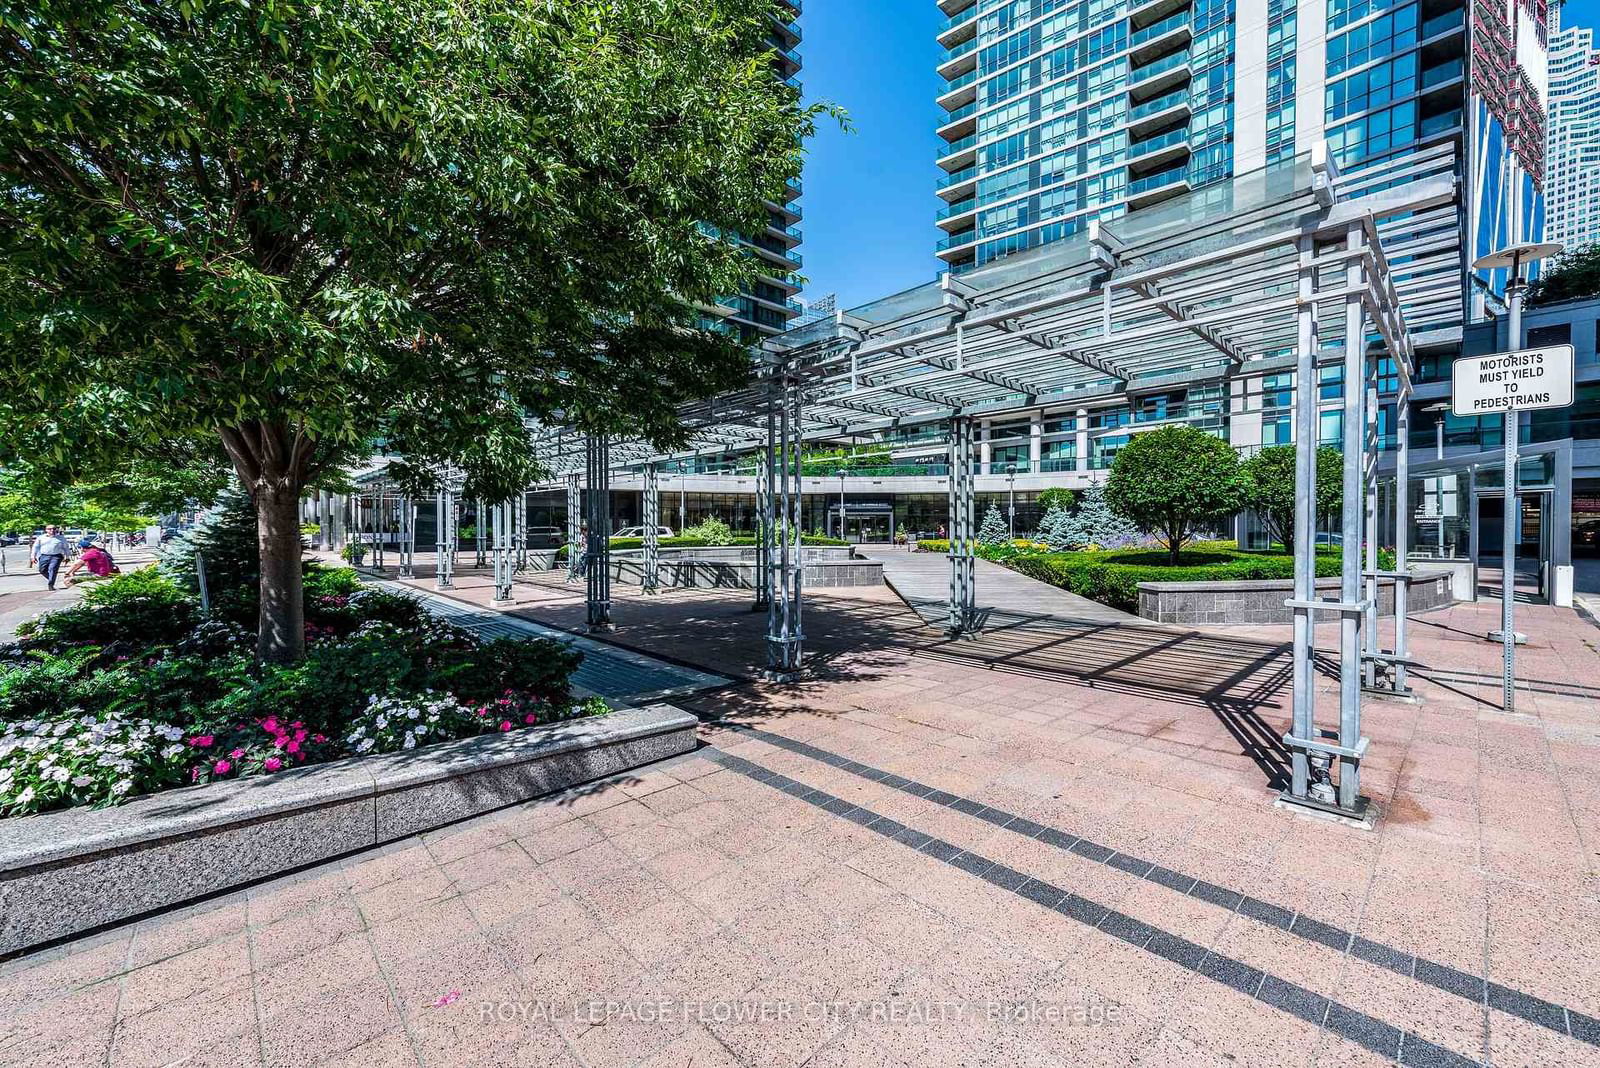
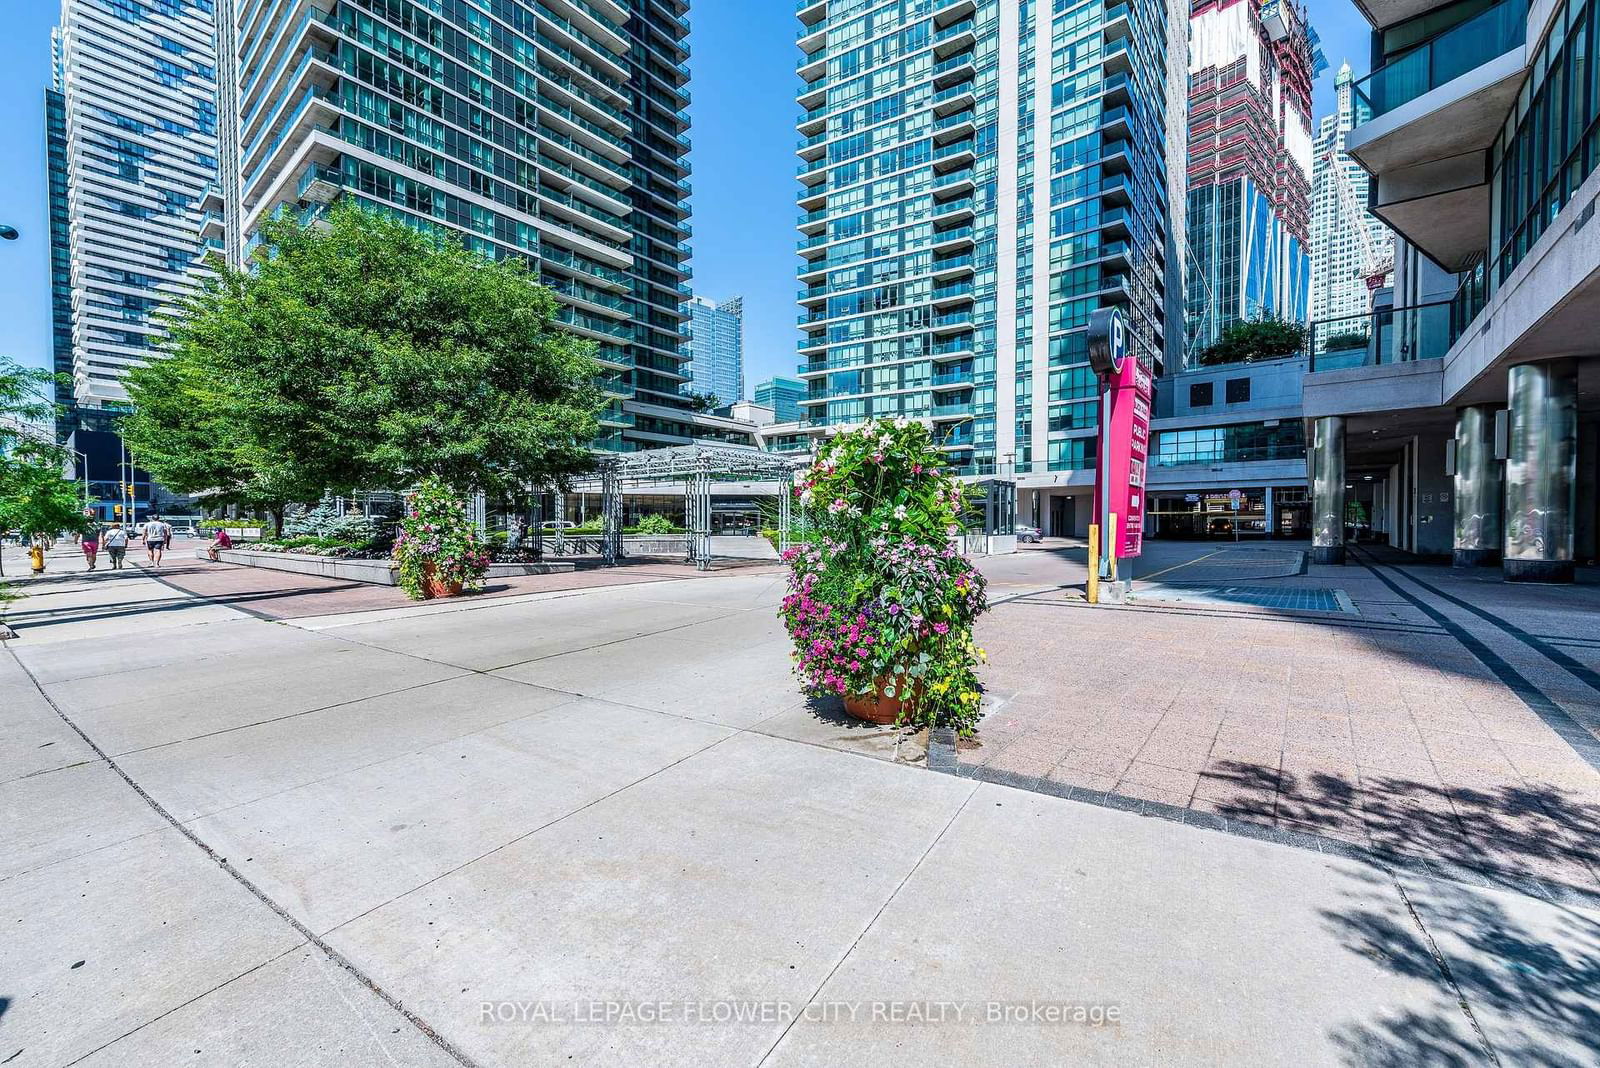
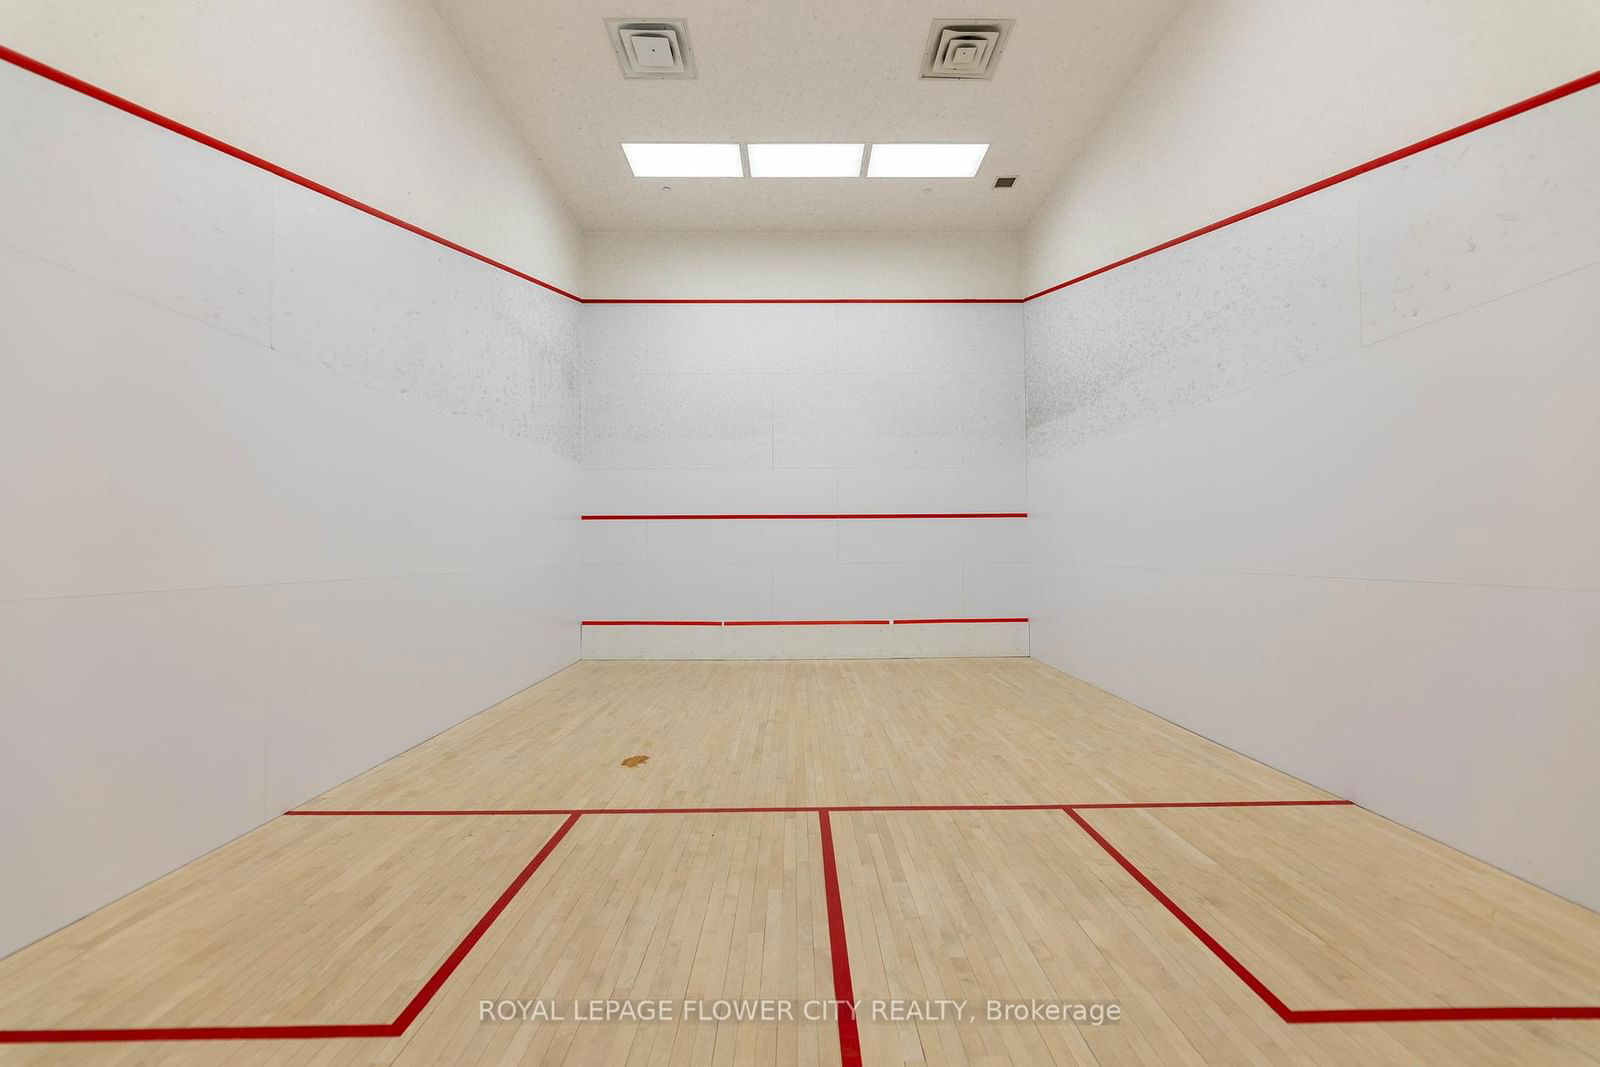
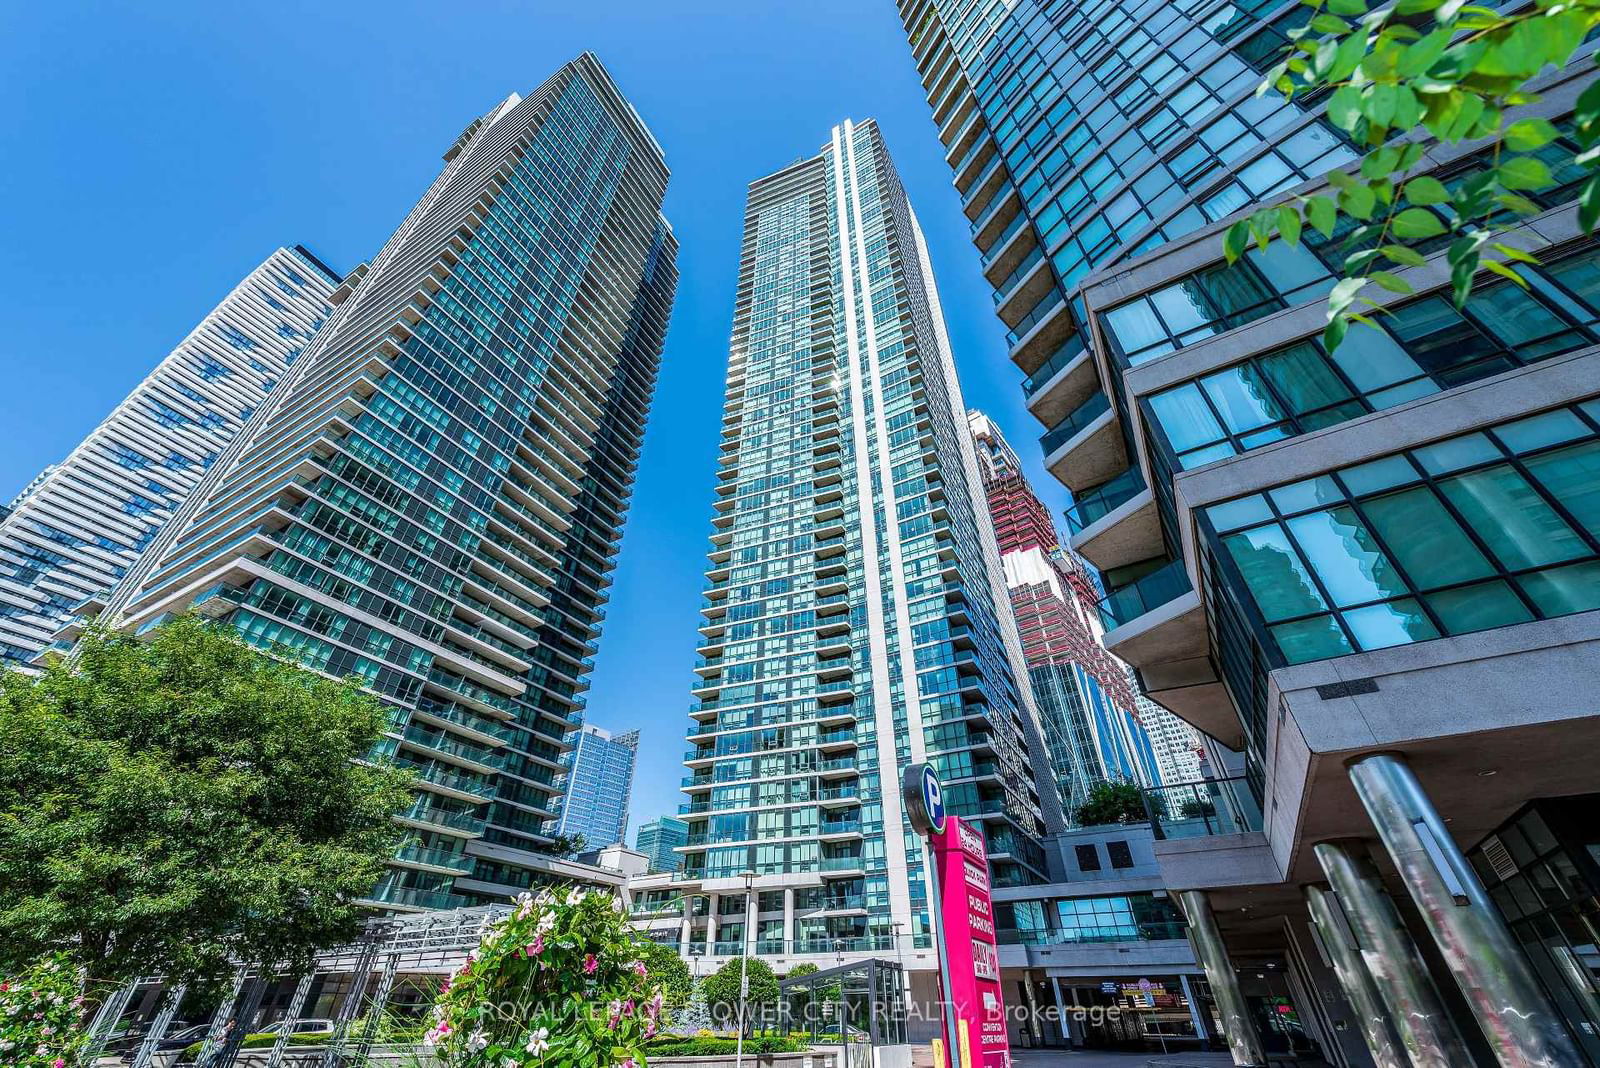
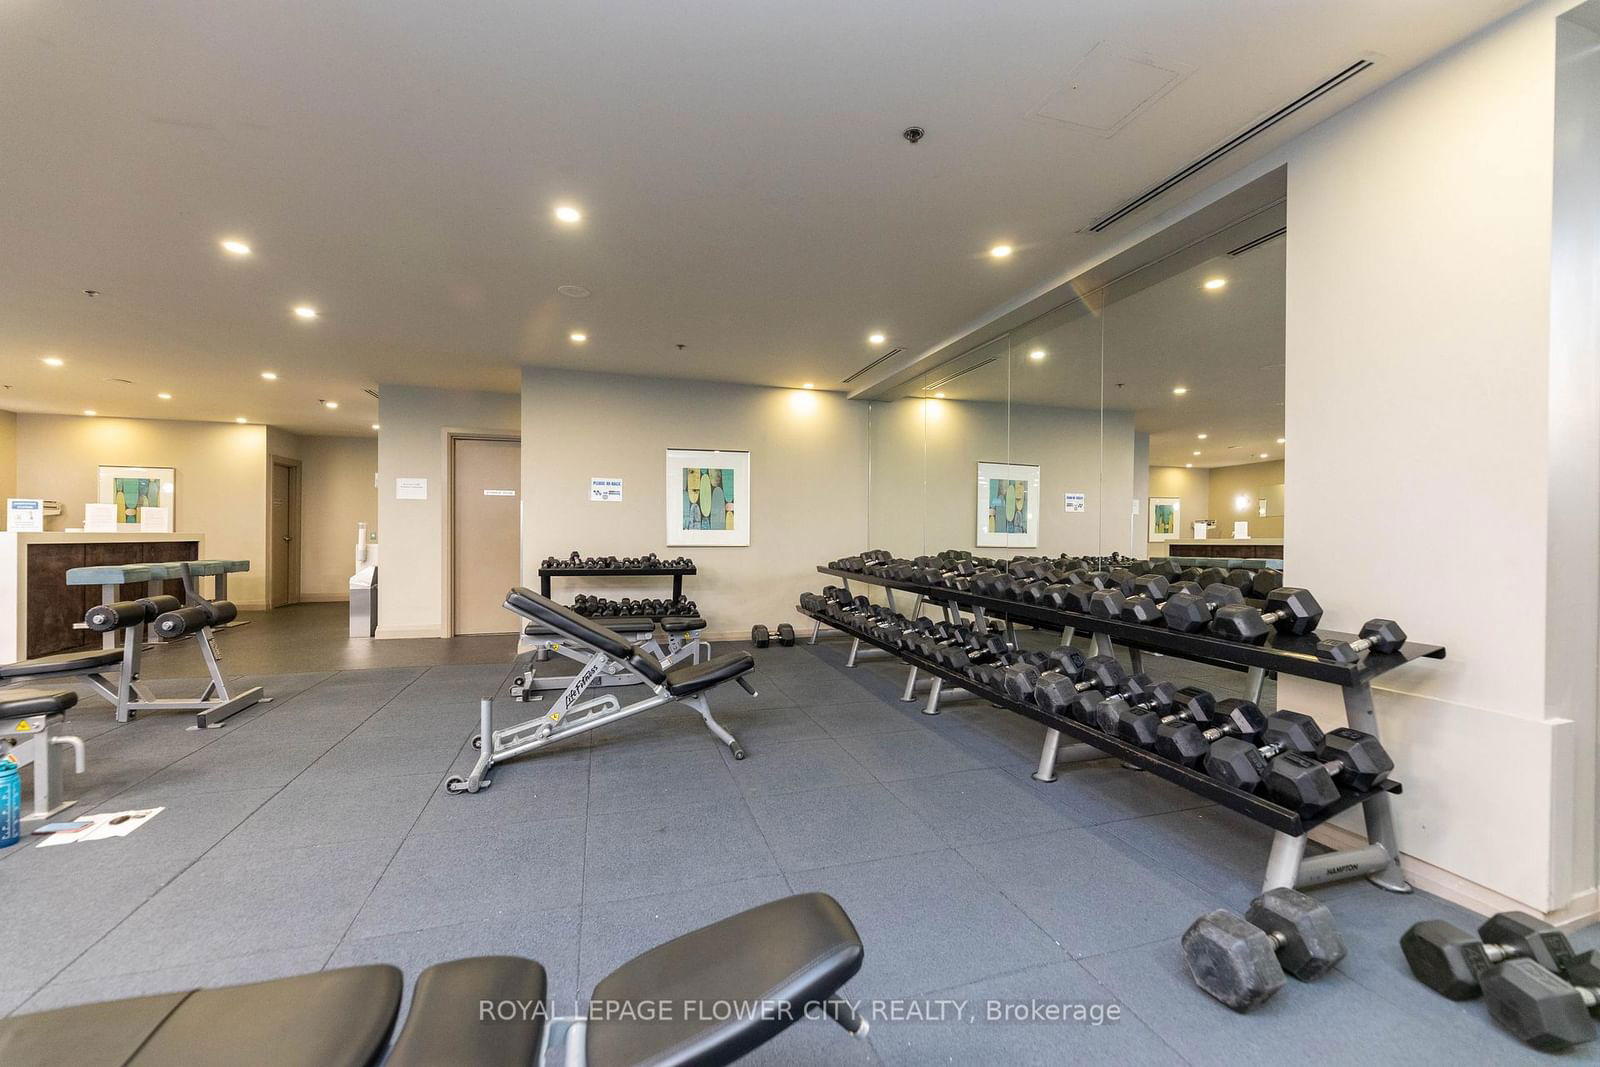
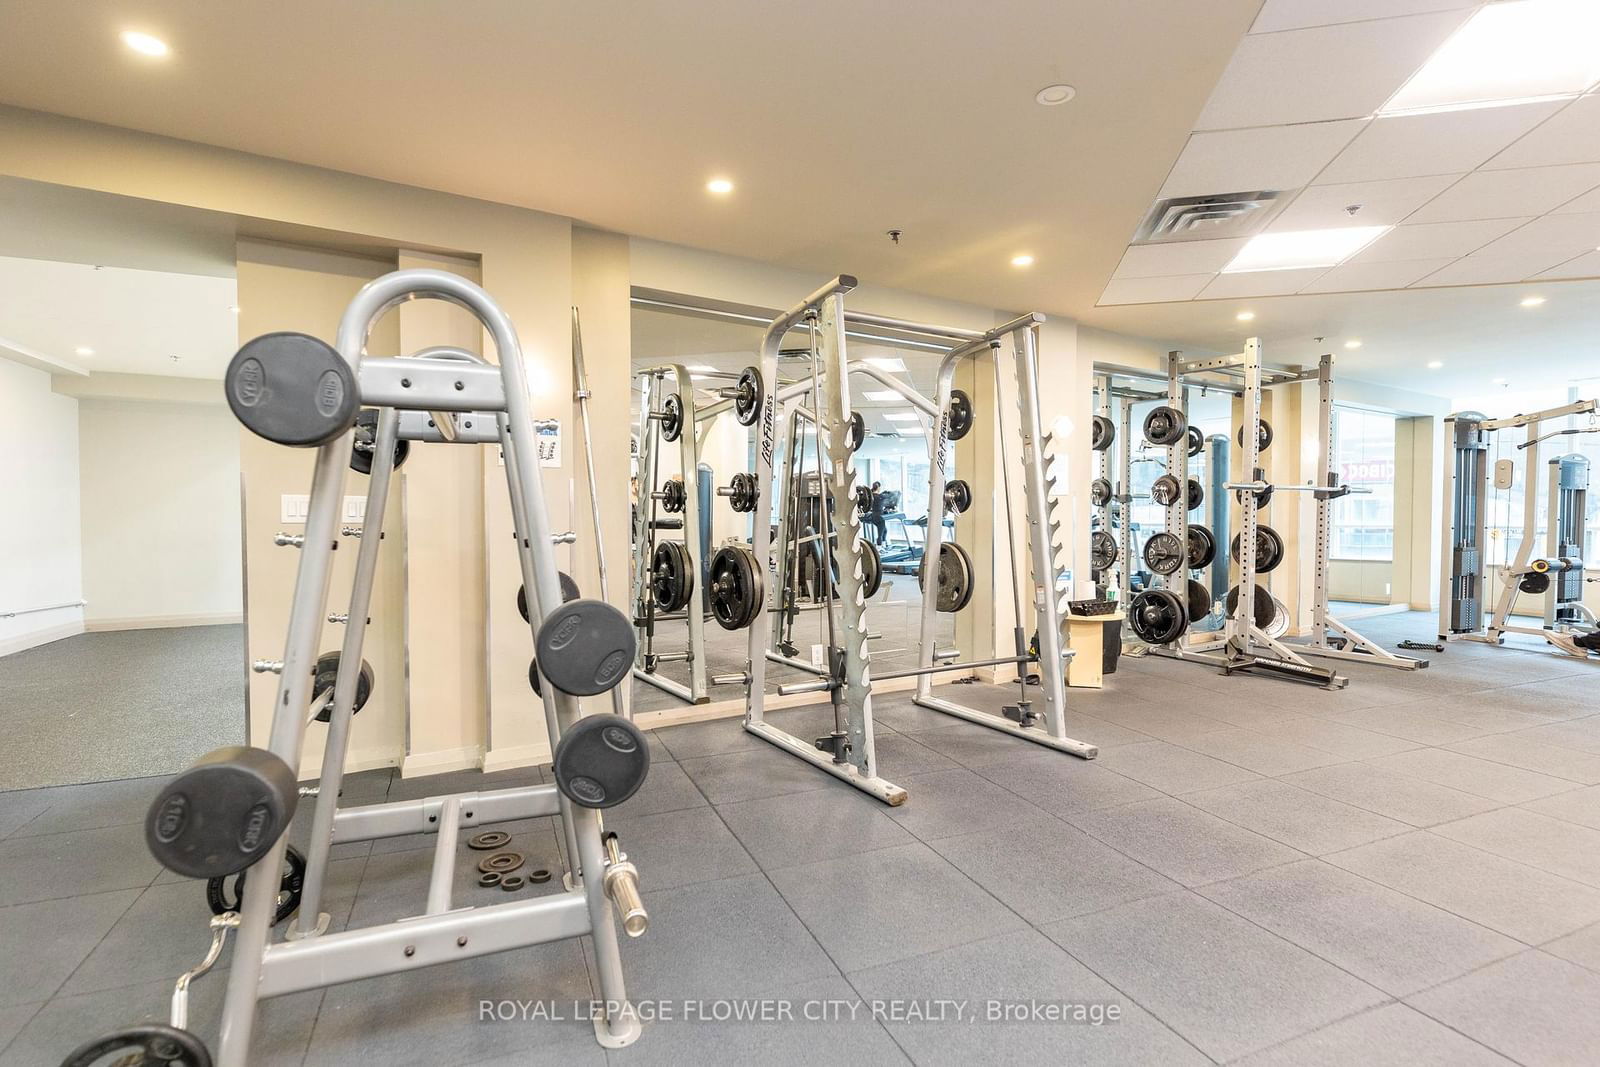
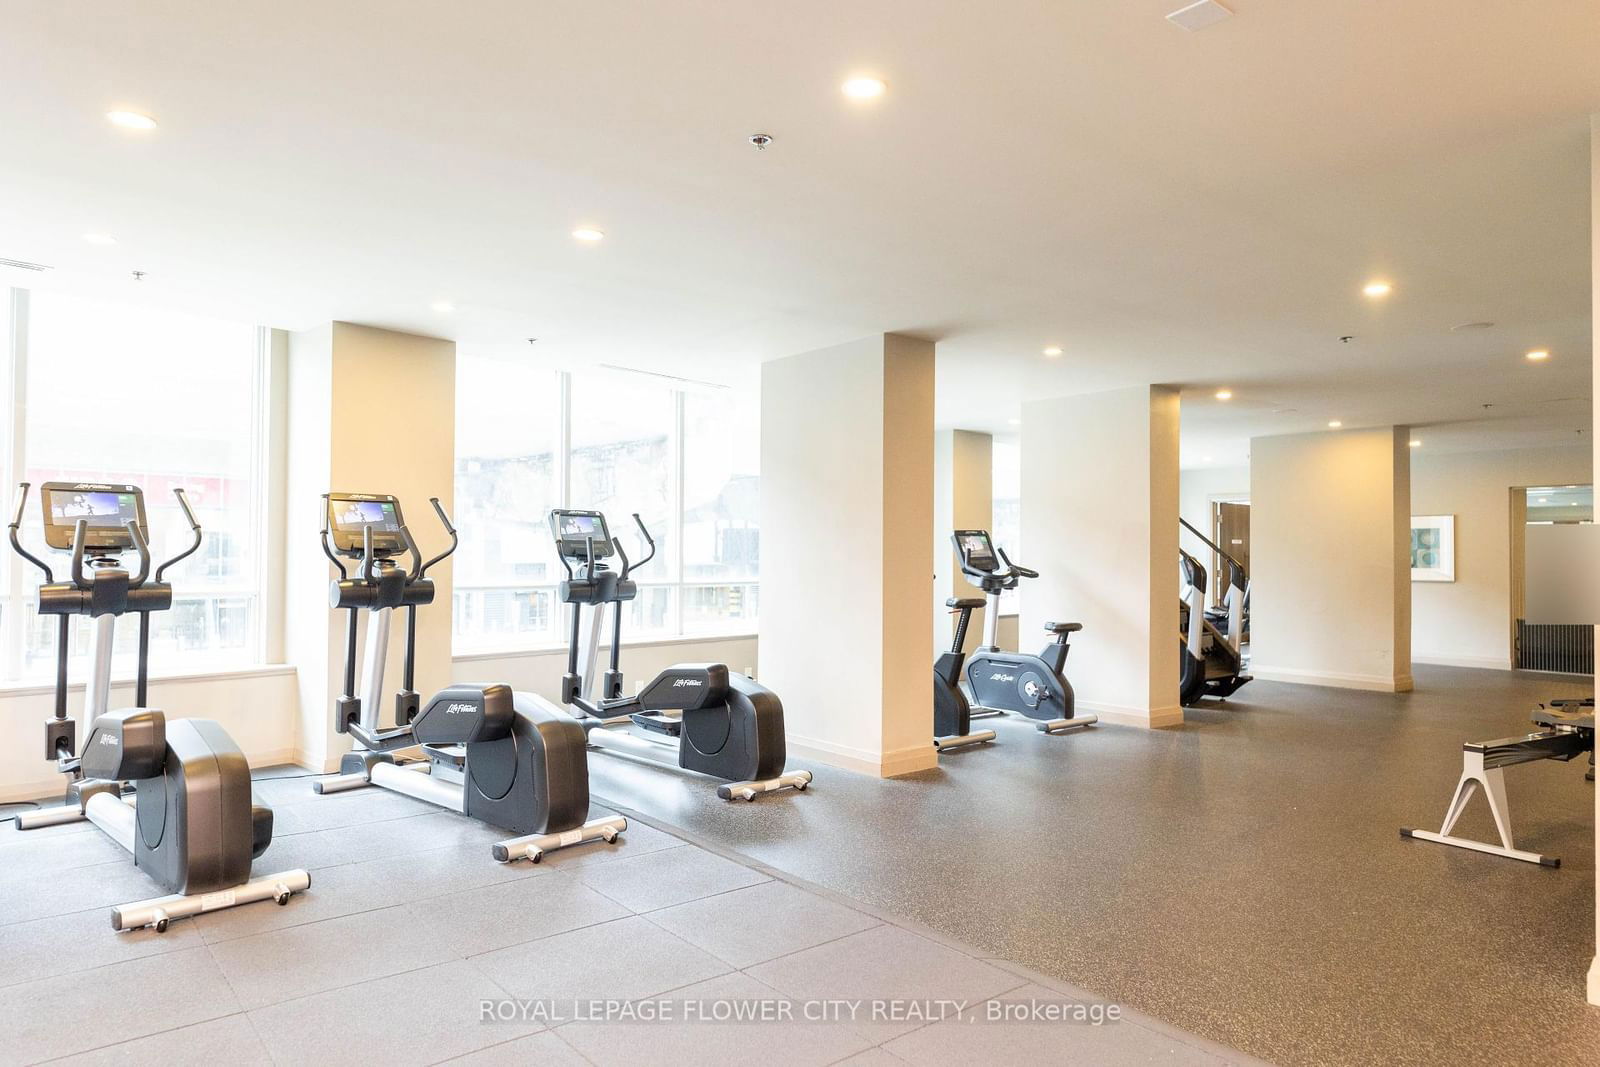
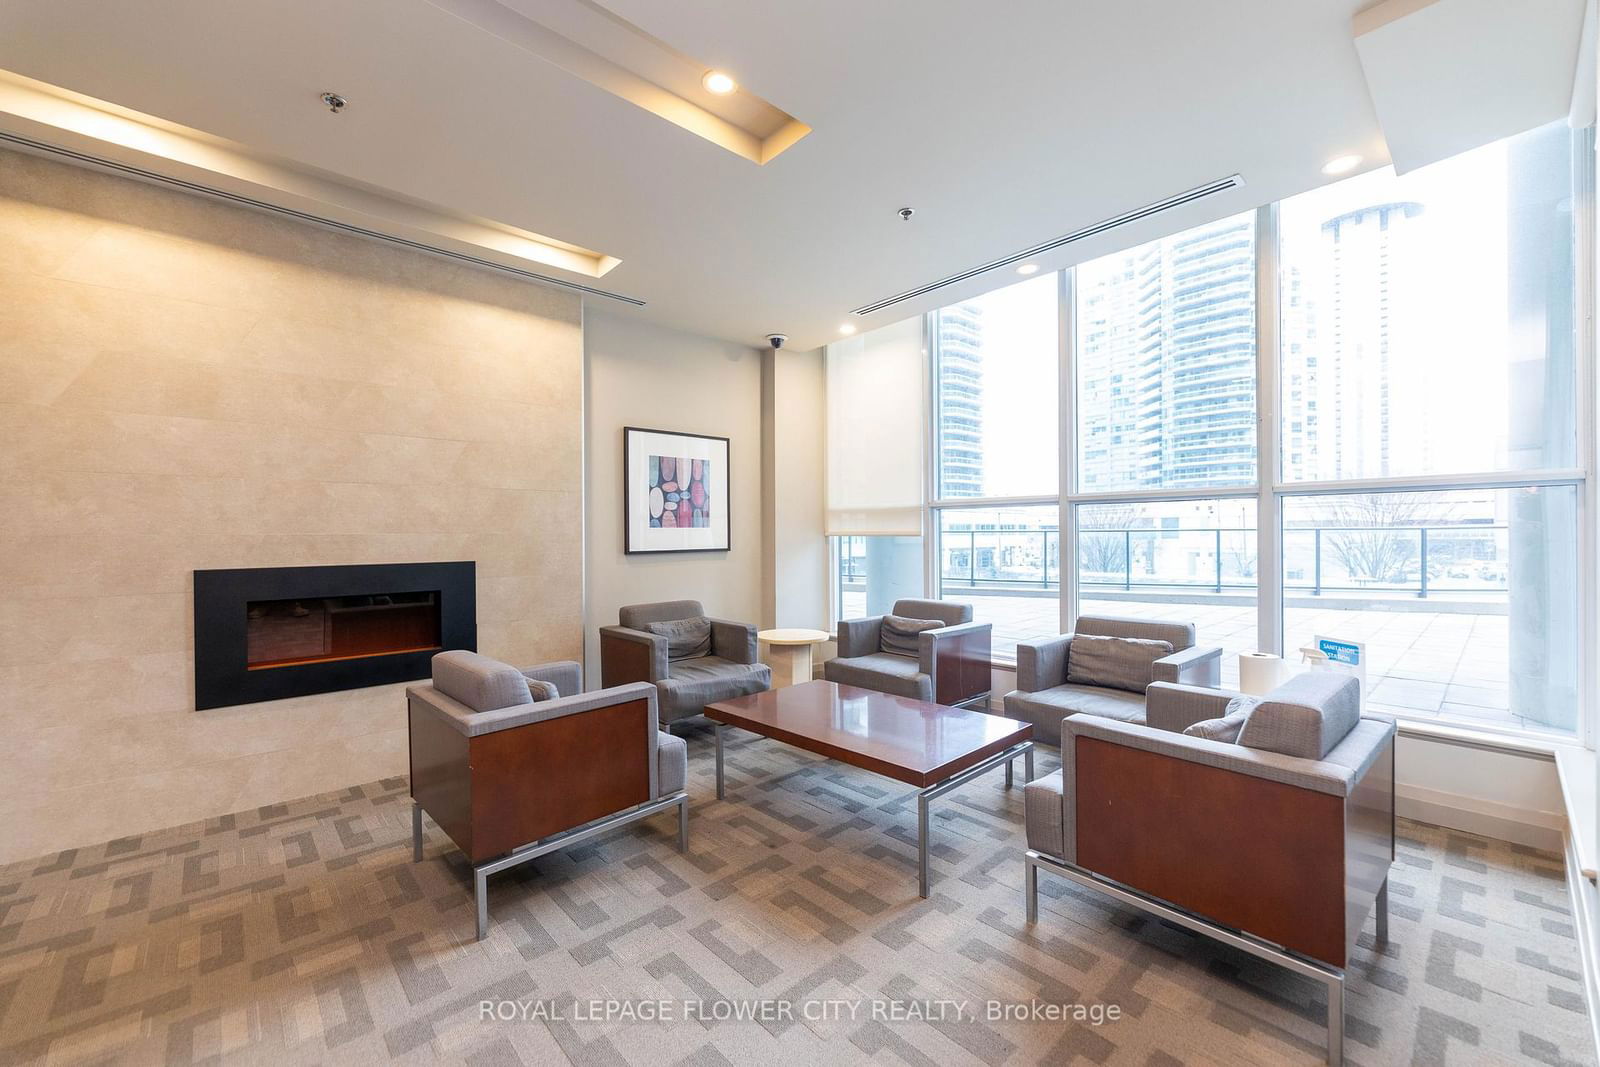
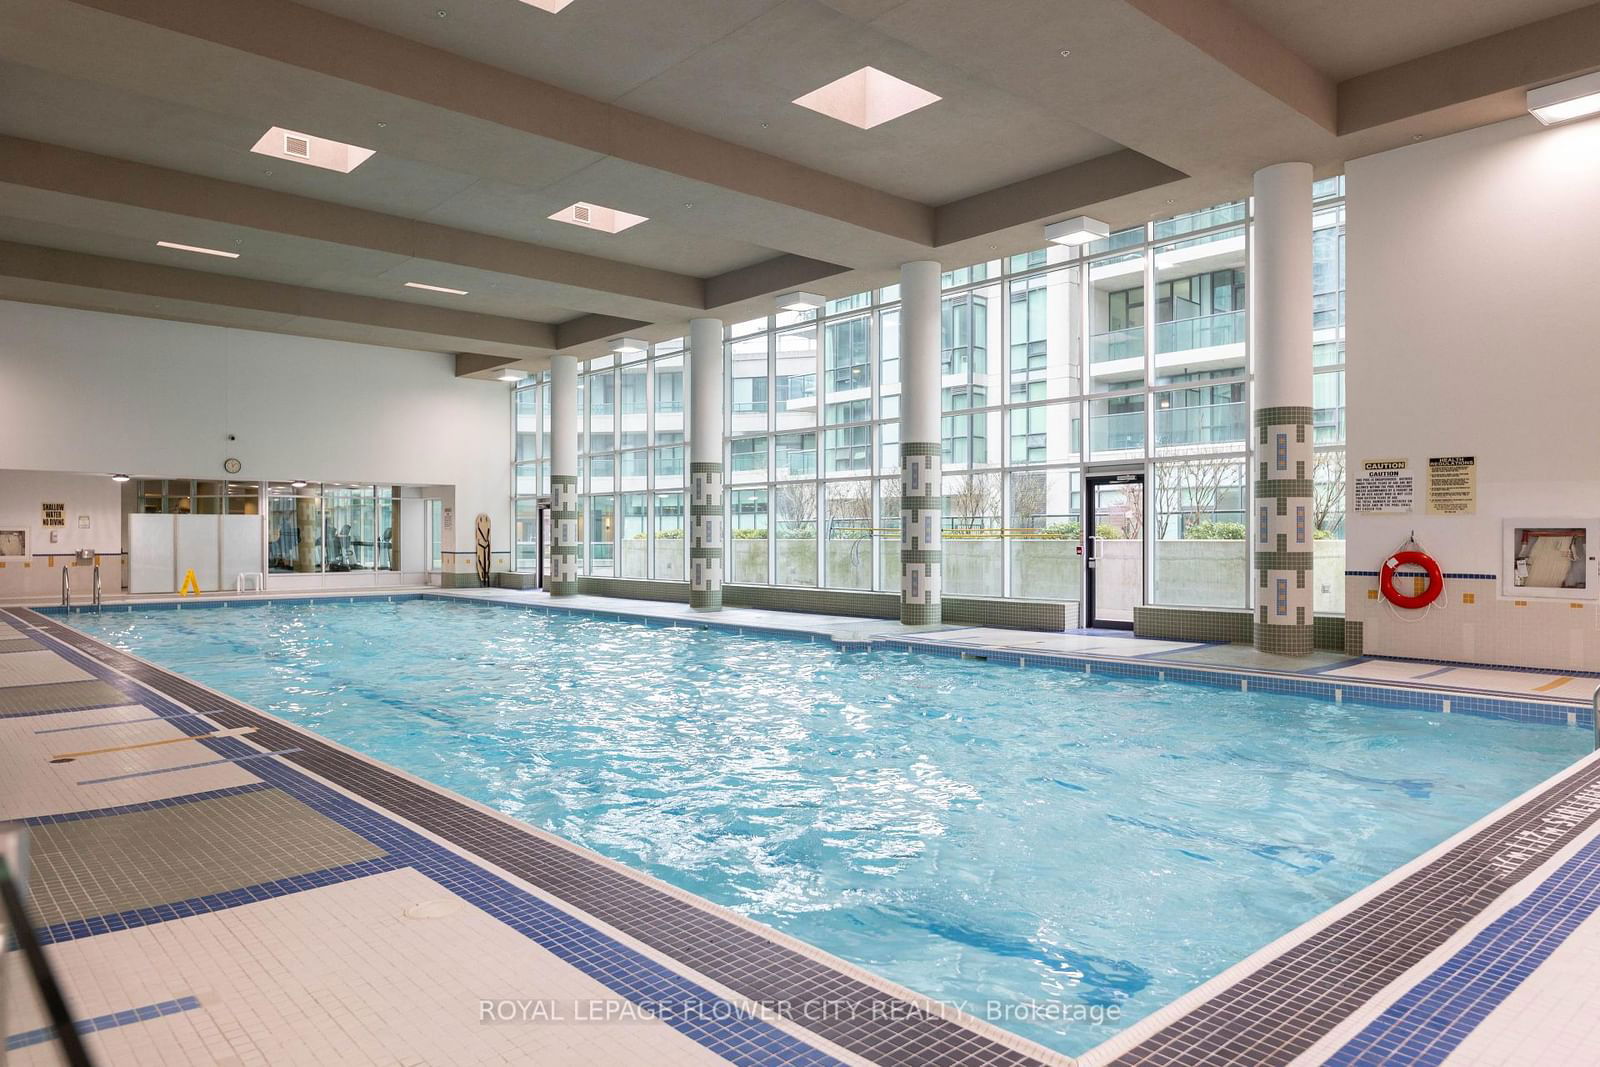
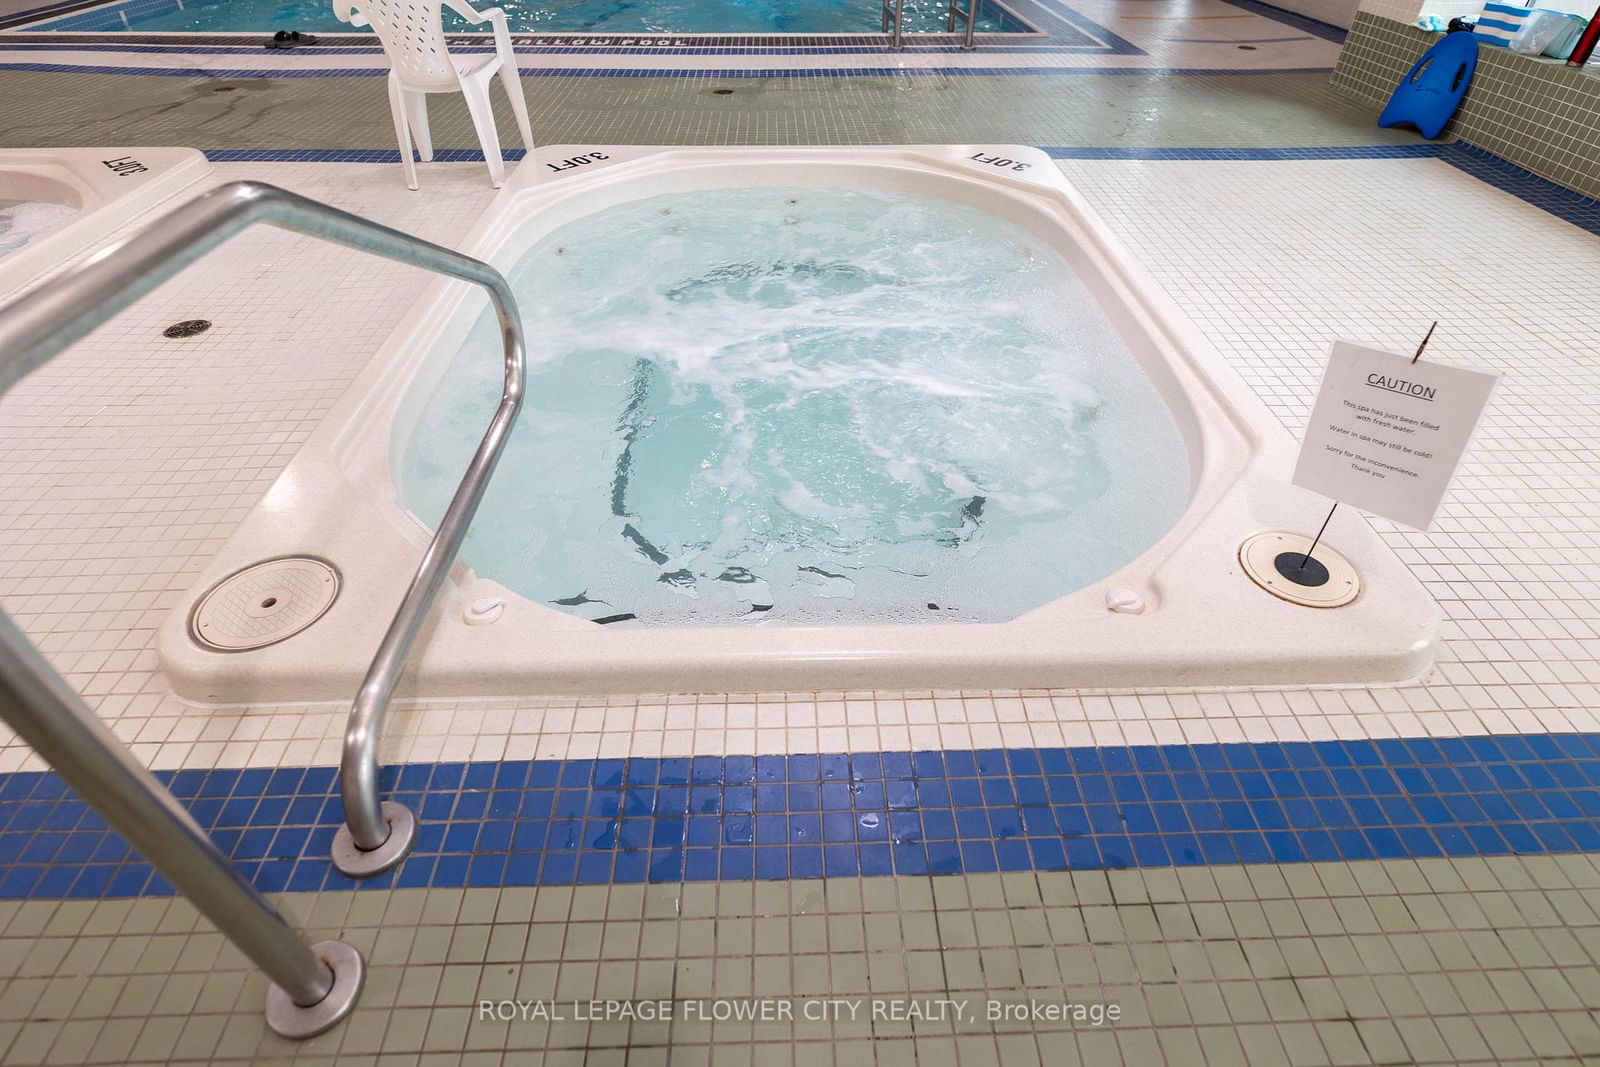
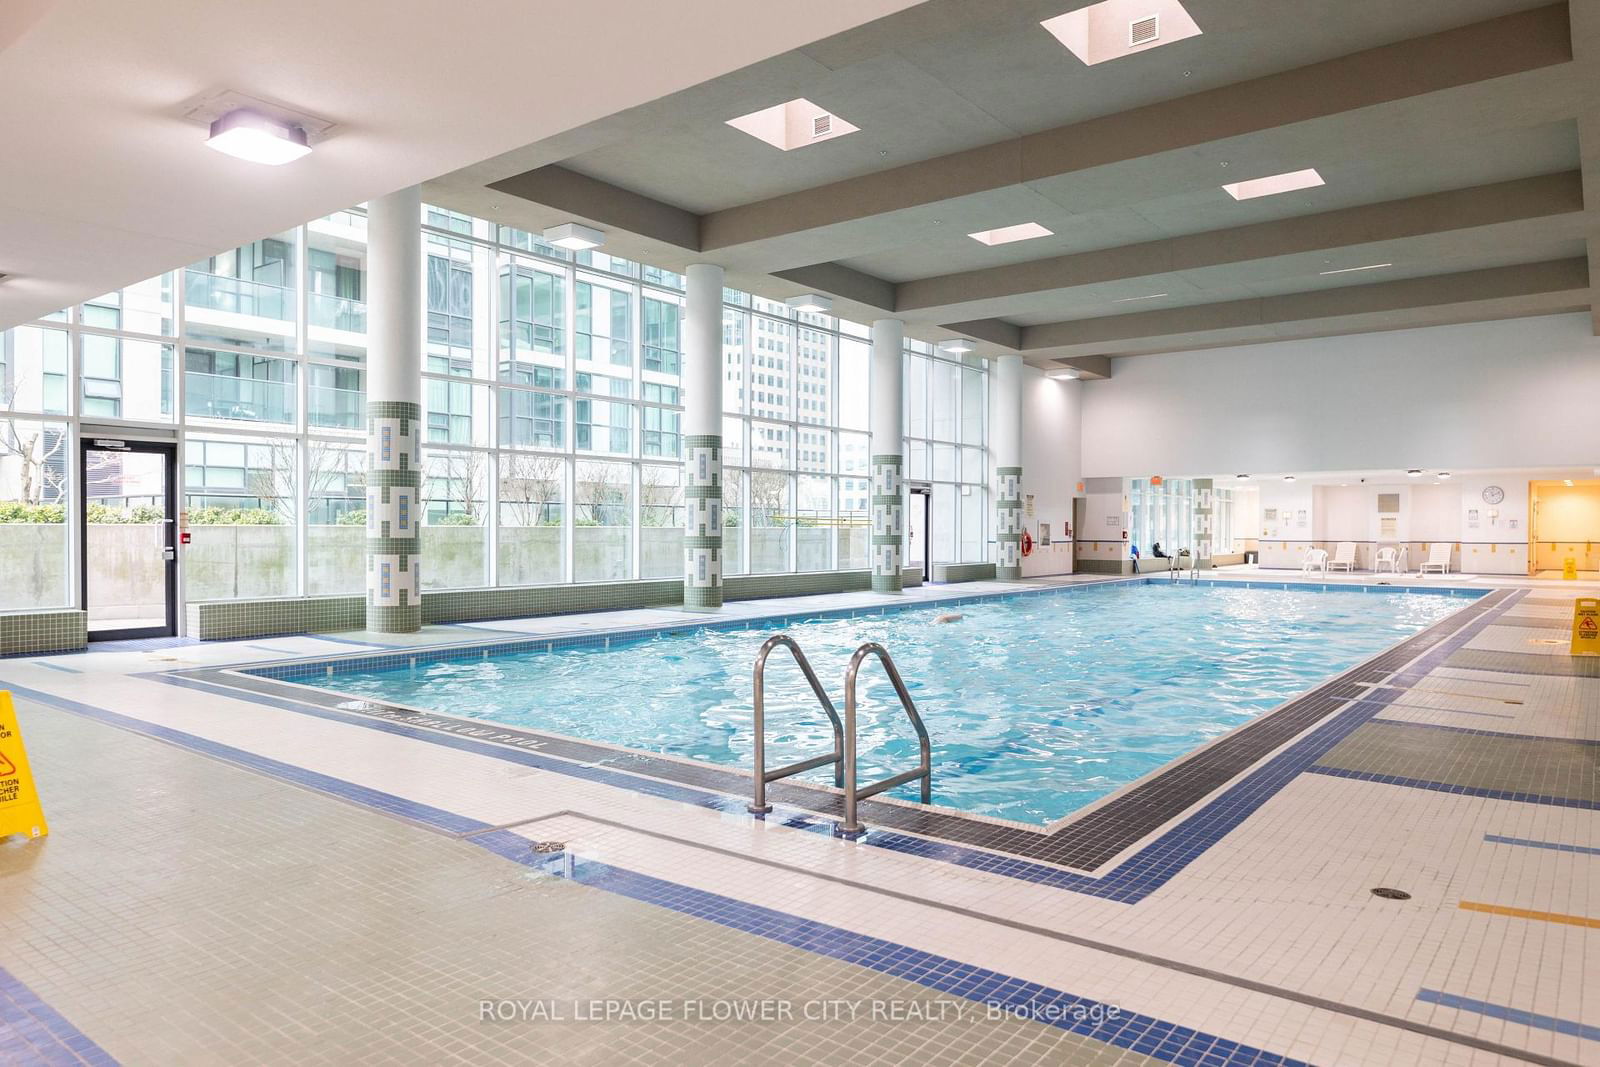
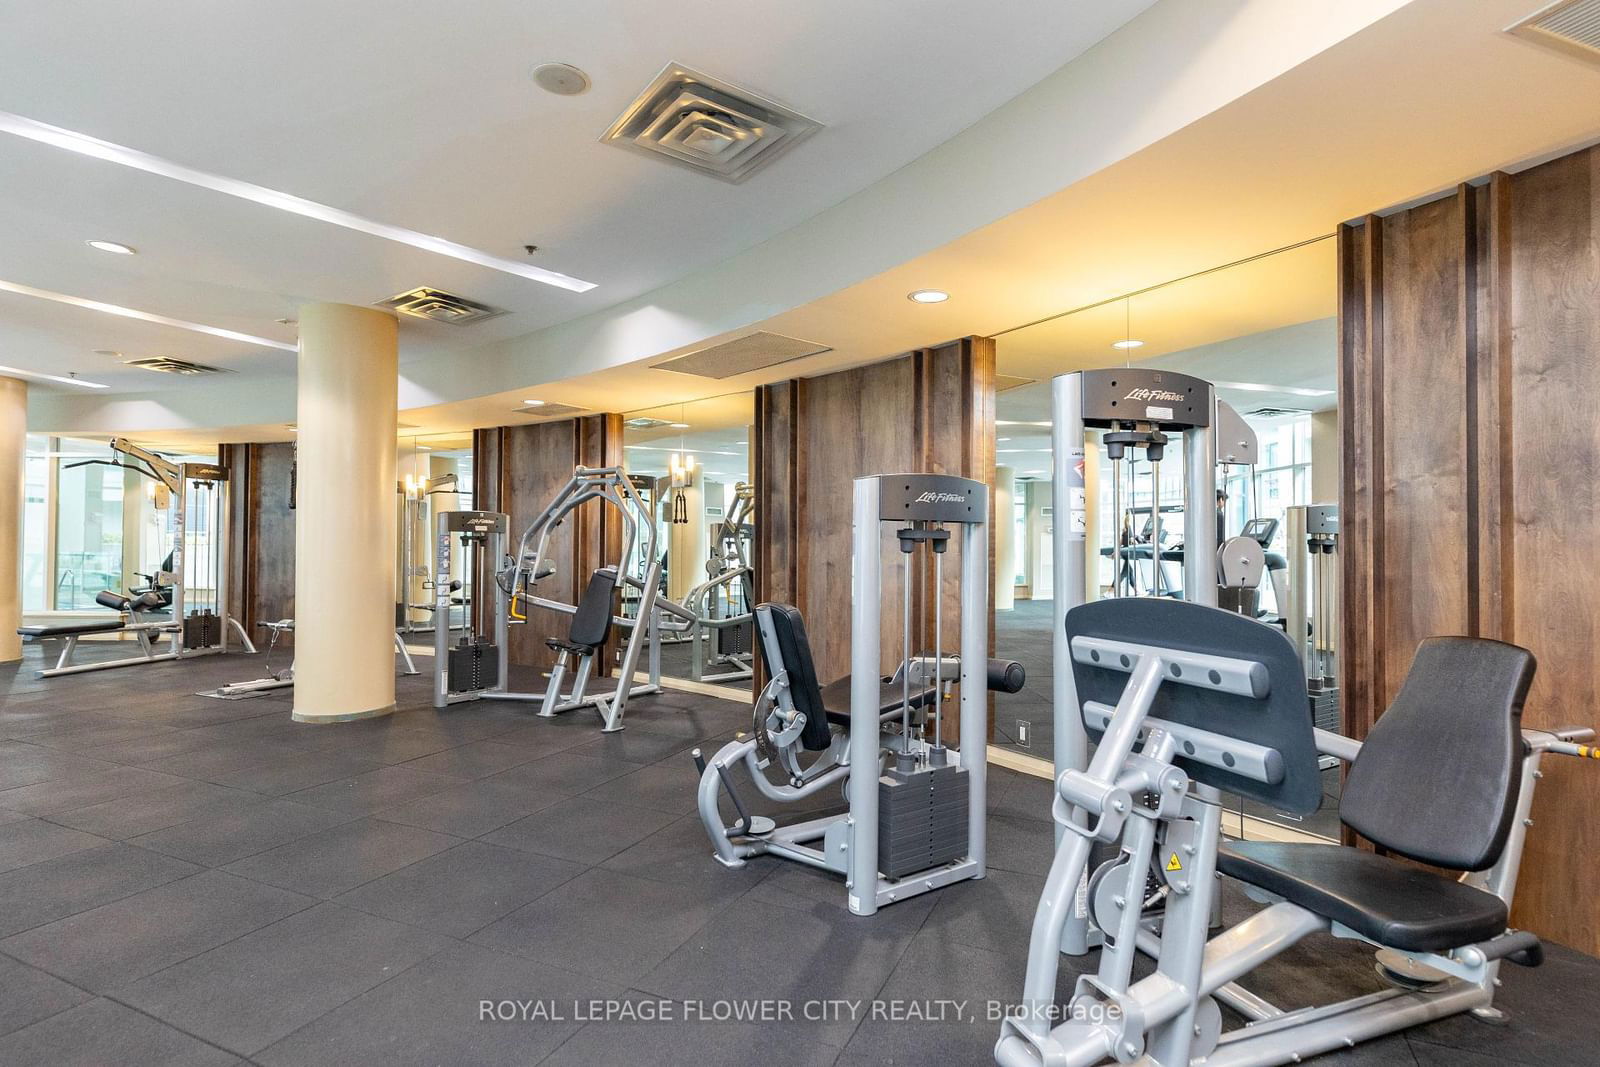
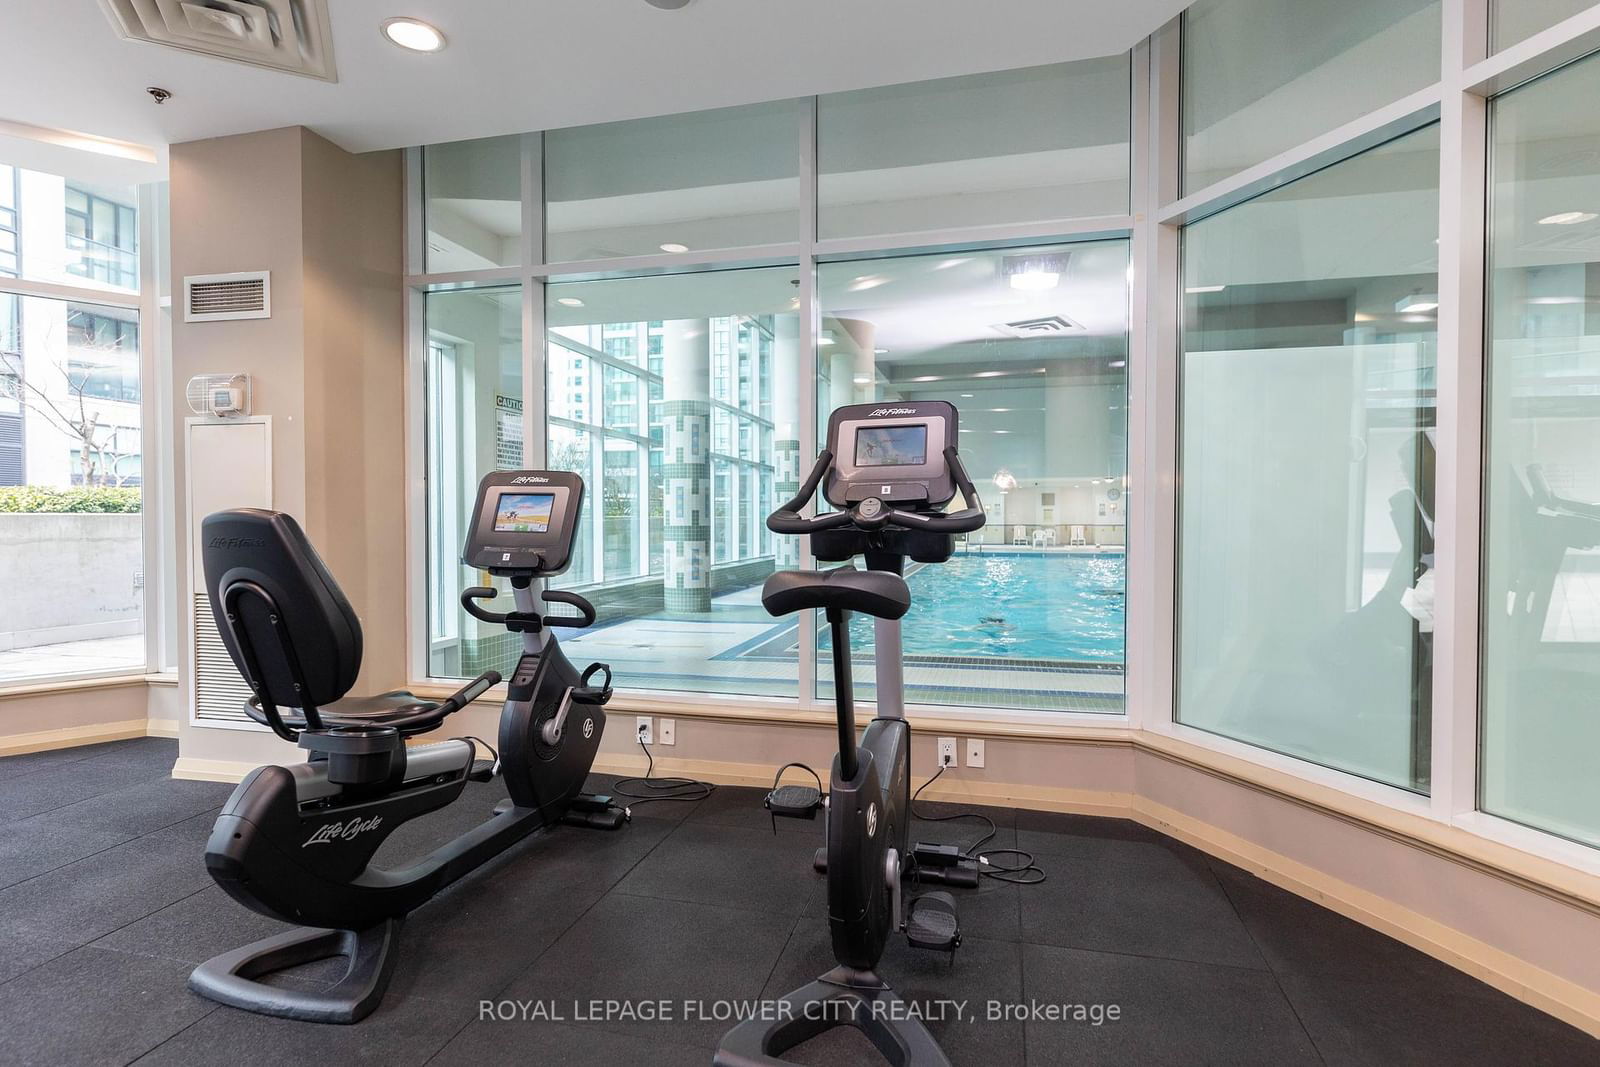
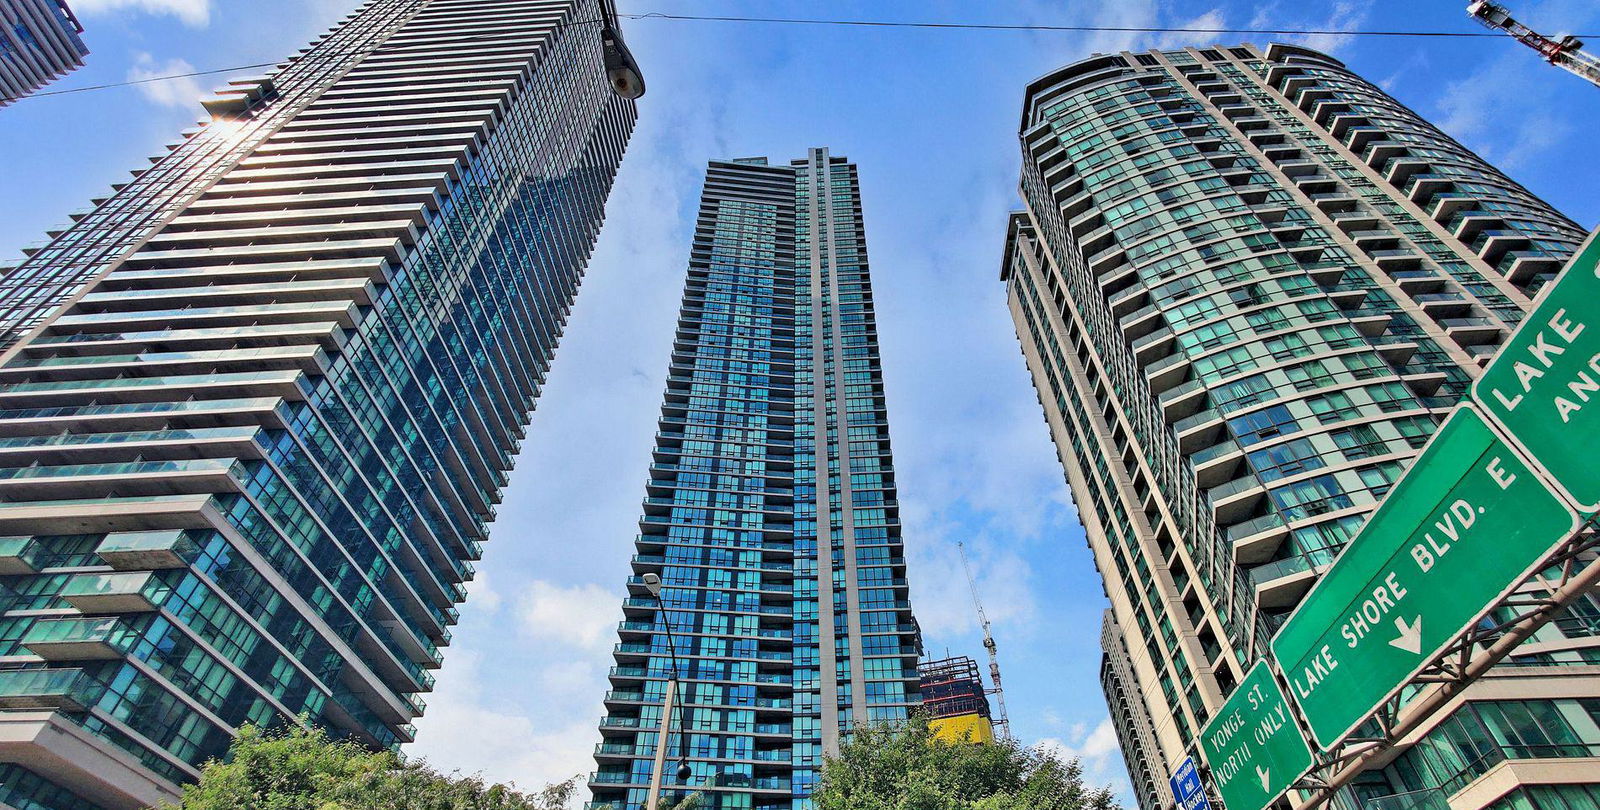
Welcome To Luxury At The Success Tower. 797Sf+47Sf Balcony, 2 Bed 2 Bath, One Owned Parking. New Painting & Flooring, Under mount Sink, Walk In Closet & 4pc Ensuite In the Primary Bedroom, Very Good Condition, Offering 30,000Sf Of Amenities With Olympic 24M Indoor Pool W/Dry & Steam Sauna, Tennis Court, Squash Room, Basketball Room, 2 Gyms, Theatre, Bbq Place, Outside Golf Putting Green, Great Maintaining Bd, Low Maintenance Fee, Next To The Scotia Centre, Steps To Waterfront, Financial District, Near Union Station.
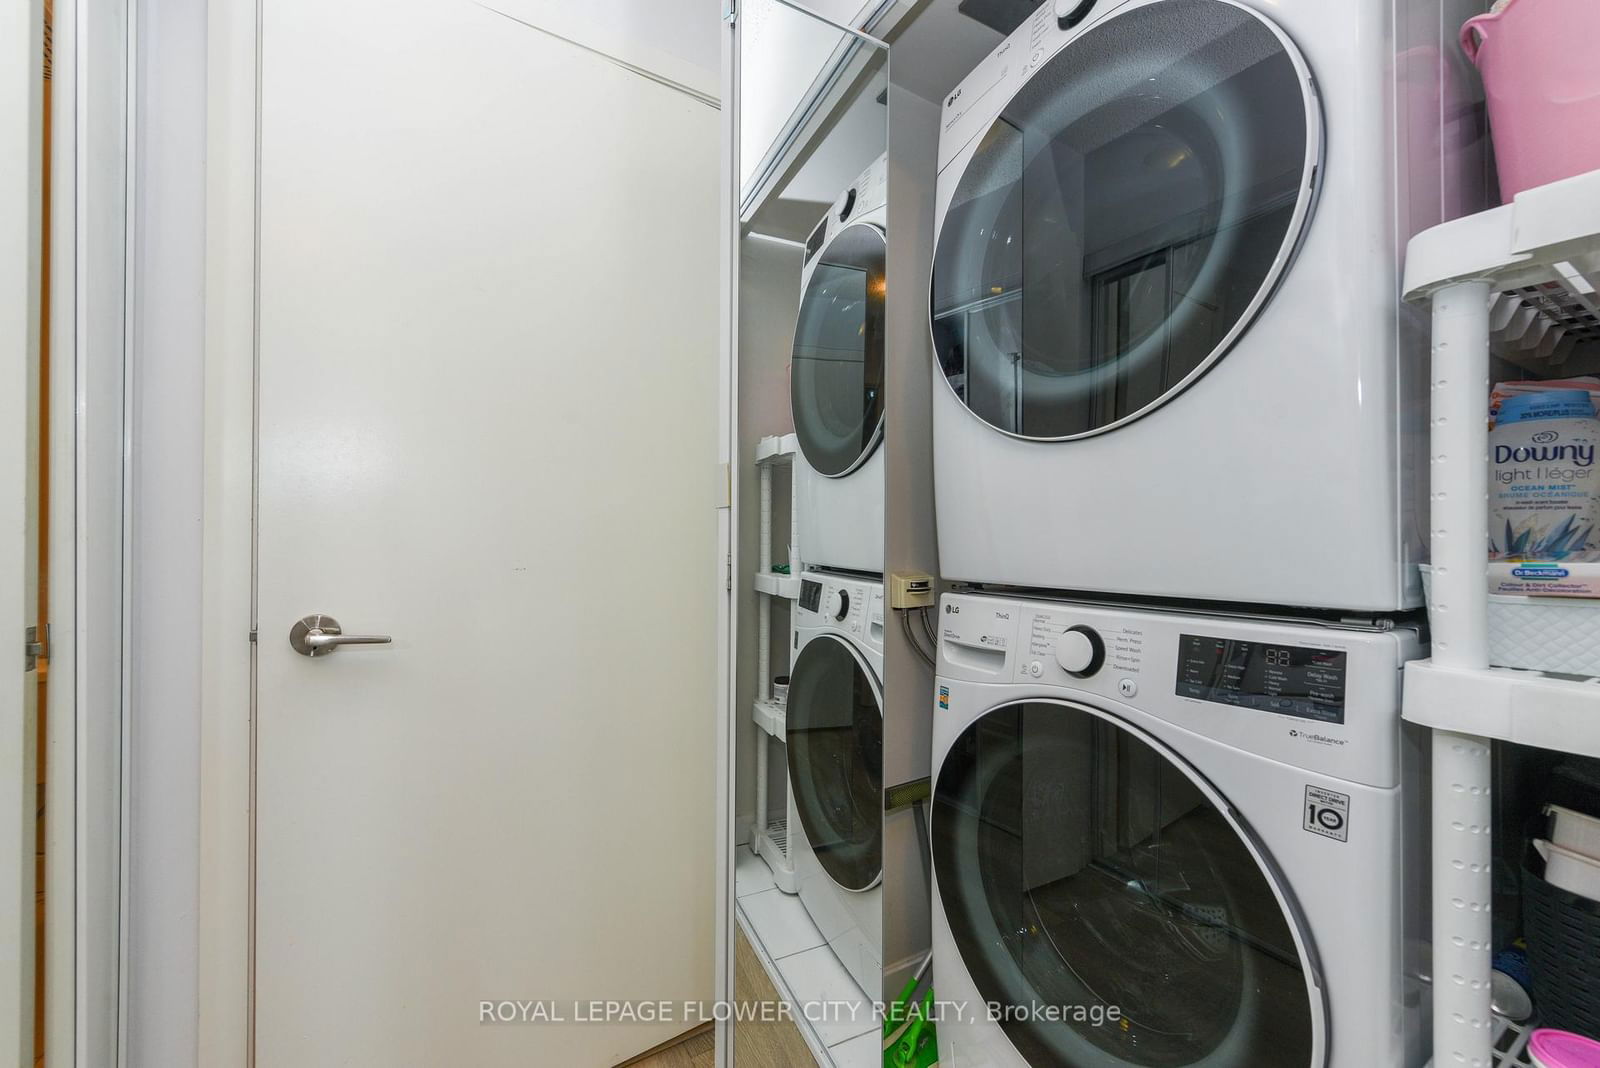
ExtrasVery Well Maintained. All Existing Appliances: S/S Fridge, Stove, Microwave, Built-In Dishwasher, Exhaust Fan, Washer, Dryer, All Existing Electronic Light Fixture. Success Can Be Found In The Success Tower!
royal lepage flower city realtyMLS® #C12049558
Features
Maintenance Fees
Utility Type
- Air Conditioning
- Central Air
- Heat Source
- No Data
- Heating
- Forced Air
Amenities
Room Dimensions
Building Spotlight
Similar Listings
Explore The Waterfront
Commute Calculator

Demographics
Based on the dissemination area as defined by Statistics Canada. A dissemination area contains, on average, approximately 200 – 400 households.
Building Trends At Success Tower
Days on Strata
List vs Selling Price
Offer Competition
Turnover of Units
Property Value
Price Ranking
Sold Units
Rented Units
Best Value Rank
Appreciation Rank
Rental Yield
High Demand
Market Insights
Transaction Insights at Success Tower
| Studio | 1 Bed | 1 Bed + Den | 2 Bed | 2 Bed + Den | 3 Bed | 3 Bed + Den | |
|---|---|---|---|---|---|---|---|
| Price Range | No Data | No Data | $630,000 - $665,000 | $760,000 - $872,000 | $867,000 - $900,000 | $1,598,000 - $1,800,000 | No Data |
| Avg. Cost Per Sqft | No Data | No Data | $1,016 | $1,069 | $1,027 | $1,043 | No Data |
| Price Range | No Data | $2,225 - $2,595 | $2,350 - $2,700 | $3,000 - $3,550 | $3,450 - $4,100 | $5,995 | $5,000 - $5,100 |
| Avg. Wait for Unit Availability | No Data | 153 Days | 66 Days | 71 Days | 73 Days | 117 Days | 413 Days |
| Avg. Wait for Unit Availability | No Data | 47 Days | 16 Days | 18 Days | 23 Days | 79 Days | 168 Days |
| Ratio of Units in Building | 1% | 10% | 27% | 28% | 24% | 11% | 4% |
Market Inventory
Total number of units listed and sold in Waterfront
