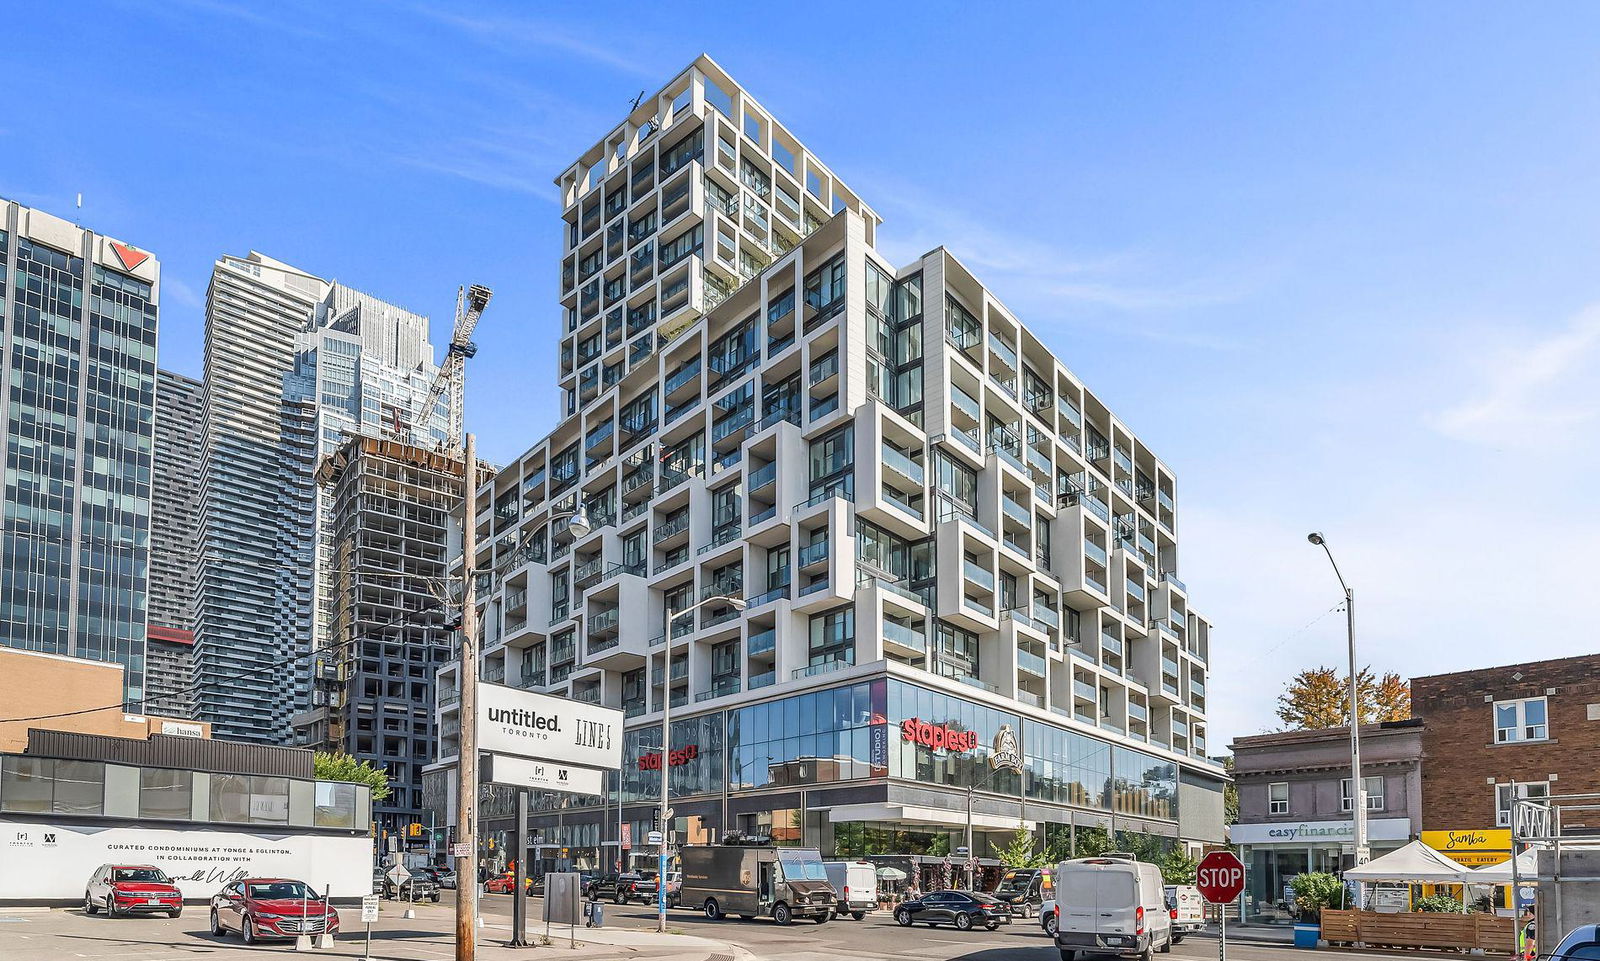
1610 - 5 Soudan Ave
Listing History
Unit Highlights
About this Listing
Trendy & Stylish Art Shoppe Conds. Conveniently Located At The Heart of Midtown. Neighbourhood w/ 99/100 Walk Score & 92/100 Transit Score. Flr To Ceiling Windows & Patio Drs Draw In Bright Natural Lights. Spacious. Opn. Concept. Closet To 10-Ft Ceilings. Modern Kitchen W/ S/S & Panelled Appl. Large Closets. Amenties Incld One TO's Longest Infinity Rooftop Pools. Hot Tub. State of The Art Gym Rm, Party Rm, Play Rm, Private Theatre, Lounge Area Equipped w/ Cabanas, Juice Bar, Private Dining Rm, etc. All Waiting For You To Discover & Enjoy. Step To Eglinton Subway Station & Future LRT. Rest, Banks, Grocery Store & Shopping @ Your Finger Tips. Extra Storage Makes Easy w/ Owned Locker @The Same Flr. Tenants Pay All Utilities (Heat, Hydro & Water).
nu stream realty (toronto) inc.MLS® #C11981459
Features
Utilities Included
Utility Type
- Air Conditioning
- Central Air
- Heat Source
- No Data
- Heating
- Forced Air
Amenities
Room Dimensions

Building Spotlight
Similar Listings
Explore Mount Pleasant West
Commute Calculator

Demographics
Based on the dissemination area as defined by Statistics Canada. A dissemination area contains, on average, approximately 200 – 400 households.
Building Trends At Art Shoppe Lofts + Condos
Days on Strata
List vs Selling Price
Offer Competition
Turnover of Units
Property Value
Price Ranking
Sold Units
Rented Units
Best Value Rank
Appreciation Rank
Rental Yield
High Demand
Market Insights
Transaction Insights at Art Shoppe Lofts + Condos
| Studio | 1 Bed | 1 Bed + Den | 2 Bed | 2 Bed + Den | 3 Bed | 3 Bed + Den | |
|---|---|---|---|---|---|---|---|
| Price Range | $365,000 - $450,000 | $474,000 | $529,500 - $656,000 | $733,000 - $869,000 | No Data | $1,688,000 | No Data |
| Avg. Cost Per Sqft | $1,217 | $1,303 | $1,075 | $1,118 | No Data | $1,145 | No Data |
| Price Range | $1,775 - $2,175 | $2,000 - $2,500 | $2,150 - $2,900 | $2,565 - $3,800 | $3,250 - $5,700 | $5,700 | No Data |
| Avg. Wait for Unit Availability | 80 Days | 53 Days | 36 Days | 26 Days | 84 Days | No Data | No Data |
| Avg. Wait for Unit Availability | 19 Days | 12 Days | 8 Days | 8 Days | 47 Days | 541 Days | No Data |
| Ratio of Units in Building | 11% | 17% | 31% | 35% | 7% | 1% | 1% |
Market Inventory
Total number of units listed and leased in Mount Pleasant West


