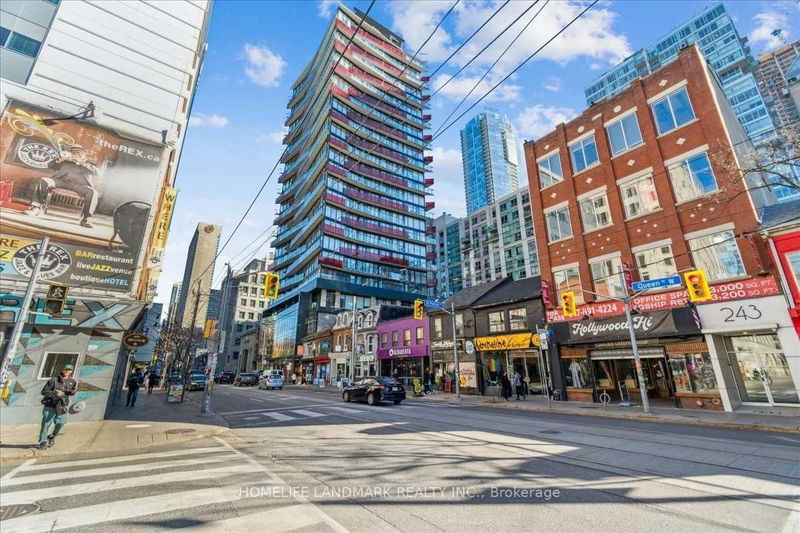
702 - 215 Queen St W


1 / 15
For SaleSmart House CondosEst Sell Timeframe 21 Days
$529,900
Price Cut: $549,900
1 Bed + 1
1 Bath
0 Parking
500 - 599 SQFT
32 Days on Strata
Listing History
Unit Highlights
Property Type:
Condo
Maintenance Fees:
$593/mth
Taxes:
$2,399 (2023)
Cost Per Sqft:
$885 - $1,060/sqft
Locker:
Owned
Outdoor Space:
Balcony
Exposure:
West
Possession Date:
August 30, 2024
Buyer's Market
Balanced
Seller's Market
Maintenance Fees
Included
Heat
Water
Building Maintenance
Building Insurance
Excluded
Hydro
Air Conditioning
Utility Type
- Air Conditioning
- Central Air
- Heat Source
- Gas
- Heating
- Forced Air
Room Dimensions
Room dimensions are not available for this listing.
About this Listing
Welcome To Smart House, 1 Bedroom + Den, Floor To Ceiling Windows, Open Concept Located In The Heart Of Downtown Toronto, Steps Away From Osgoode Station, Financial District, Surrounded By Restaurants, Shops, Beautiful West Views With A Large Balcony 100 Walk Score.
homelife landmark realty inc.MLS® #C9259832
Amenities
BBQ
Bike Storage
Rec Room
Concierge
Gym Room
Guest Suites
Explore Neighbourhood
9/10
Walkability
Congratulations, you're the mayor of Walksville! Everything's at your doorstep.
10/10
Transit
Meet the heartbeat of the city — transit so smooth, you’ll never miss a beat.
7/10
Bikeability
Your bike's the trusty steed in this urban jungle — giddy up!
Similar Listings
Demographics
Based on the dissemination area as defined by Statistics Canada. A dissemination area contains, on average, approximately 200 – 400 households.
Population
18,483
Average Individual Income
$71,628
Average Household Size
3 persons
Average Age
42
Average Household Income
$108,396
Dominant Housing Type
High Rise Apartment
Population By Age
Household Income
Housing Types & Tenancy
High Rise Apartment
43%
Semi Detached
25%
Detached
24%
Low Rise Apartment
3%
Duplex
2%
Marital Status
Commute
Languages (Primary Language)
Other
72%
Mandarin
13%
Cantonese
9%
Tagalog
2%
Arabic
1%
Spanish
1%
Urdu
1%
Korean
1%
Education
University and Above
43%
High School
21%
College
15%
None
12%
University Below Batchelor
3%
Apprenticeship
2%
Major Field of Study
Business Management
25%
Architecture & Engineering
17%
Social Sciences
12%
Health & Related Fields
10%
Math & Computer Sciences
8%
Humanities
6%
Physical Sciences
5%
Education
5%
Visual & Performing Arts
3%
Personal, Protective & Transportation Services
2%
Price Trends
Maintenance Fees
Smart House Condos vs The Queen West Area
Building Trends At Smart House Condos
Days on Strata
Units at Smart House Condos spend an average of
74
Days on Strata
based on recent sales
List vs Selling Price
On average, these condos sell for
1%
above
the list price.
Offer Competition
Condos in this building have an
AVERAGEchance of receiving
Multiple Offers
compared to other buildings in Queen West
Turnover of Units
On average, each unit is owned for
5.7
YEARS before being sold againProperty Value
11%
Increase in property value within the past twelve months
Price Ranking
2nd
Highest price per SQFT out of 49 condos in the Queen West area
Sold Units
8
Units were Sold over the past twelve months
Rented Units
71
Units were Rented over the past twelve months
Best Value Rank
Smart House Condos offers the best value out of 49 condos in the Queen West neighbourhood
?
Appreciation Rank
Smart House Condos has the highest ROI out of 49 condos in the Queen West neighbourhood
?
Rental Yield
Smart House Condos yields the highest rent prices out of 49 condos in the Queen West neighbourhood
?
High Demand
Smart House Condos is the most popular building out of 49 condos in the Queen West neighbourhood
?
Transaction Insights at 215 Queen Street W
| Studio | 1 Bed | 1 Bed + Den | 2 Bed | 2 Bed + Den | 3 Bed | |
|---|---|---|---|---|---|---|
| Price Range | $415,000 - $460,000 | $490,000 - $500,000 | $545,000 | $610,000 - $730,000 | No Data | No Data |
| Avg. Cost Per Sqft | $1,681 | $1,441 | $1,310 | $1,140 | No Data | No Data |
| Price Range | $1,900 - $2,200 | $1,850 - $2,375 | $2,225 - $2,550 | $2,500 - $3,100 | No Data | $3,690 - $4,250 |
| Avg. Wait for Unit Availability | 63 Days | 94 Days | 441 Days | 218 Days | No Data | 612 Days |
| Avg. Wait for Unit Availability | 14 Days | 12 Days | 71 Days | 25 Days | No Data | 62 Days |
| Ratio of Units in Building | 32% | 35% | 7% | 19% | 1% | 10% |
Transactions vs Inventory
Total number of units listed and sold in Queen West
