1110 - 38 Widmer St
Listing History
Unit Highlights
About this Listing
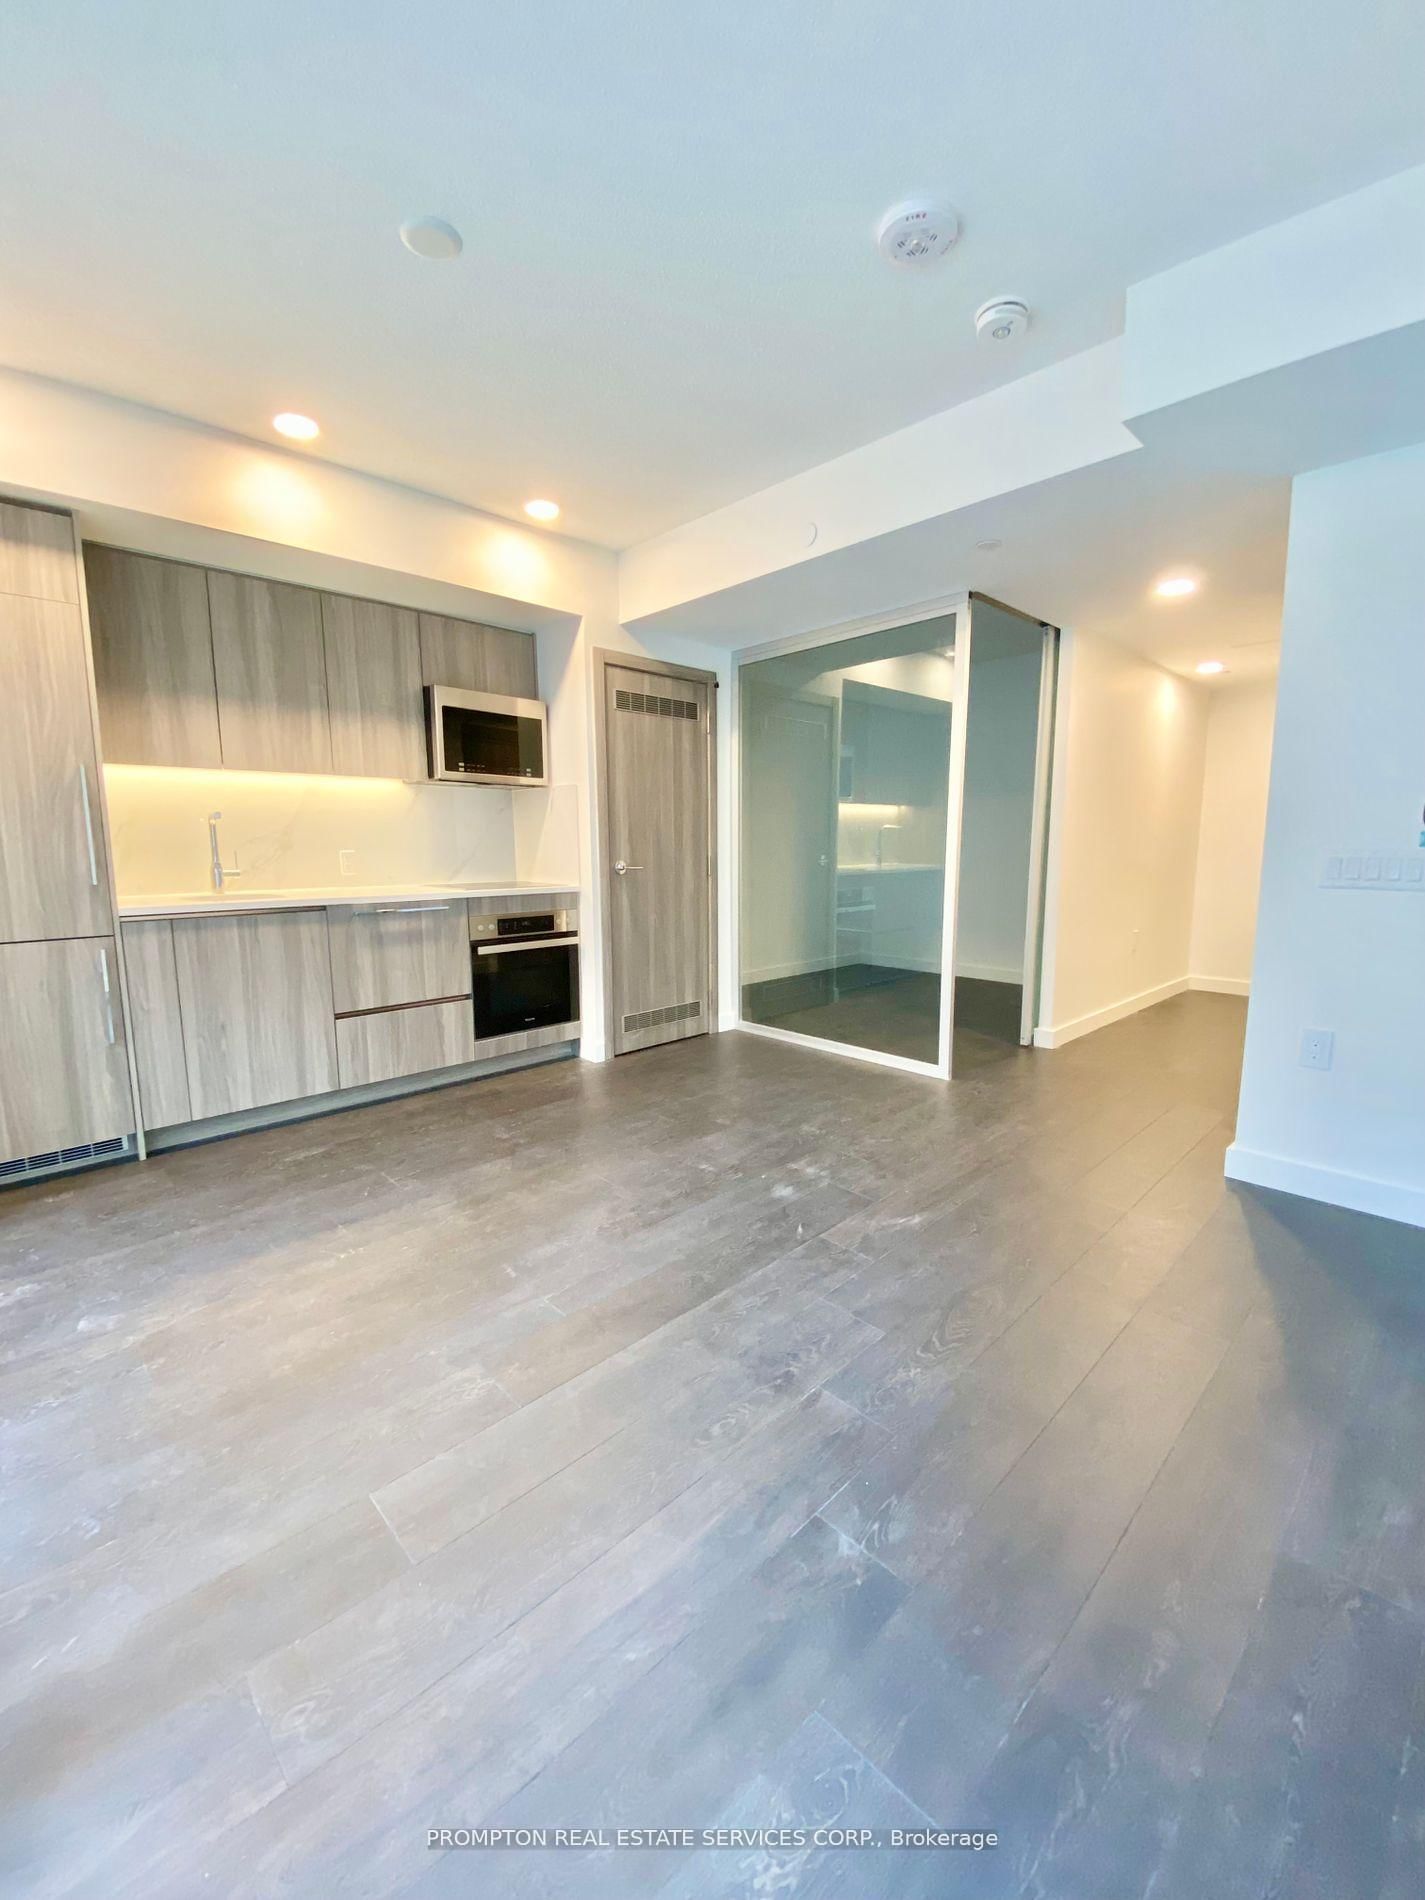
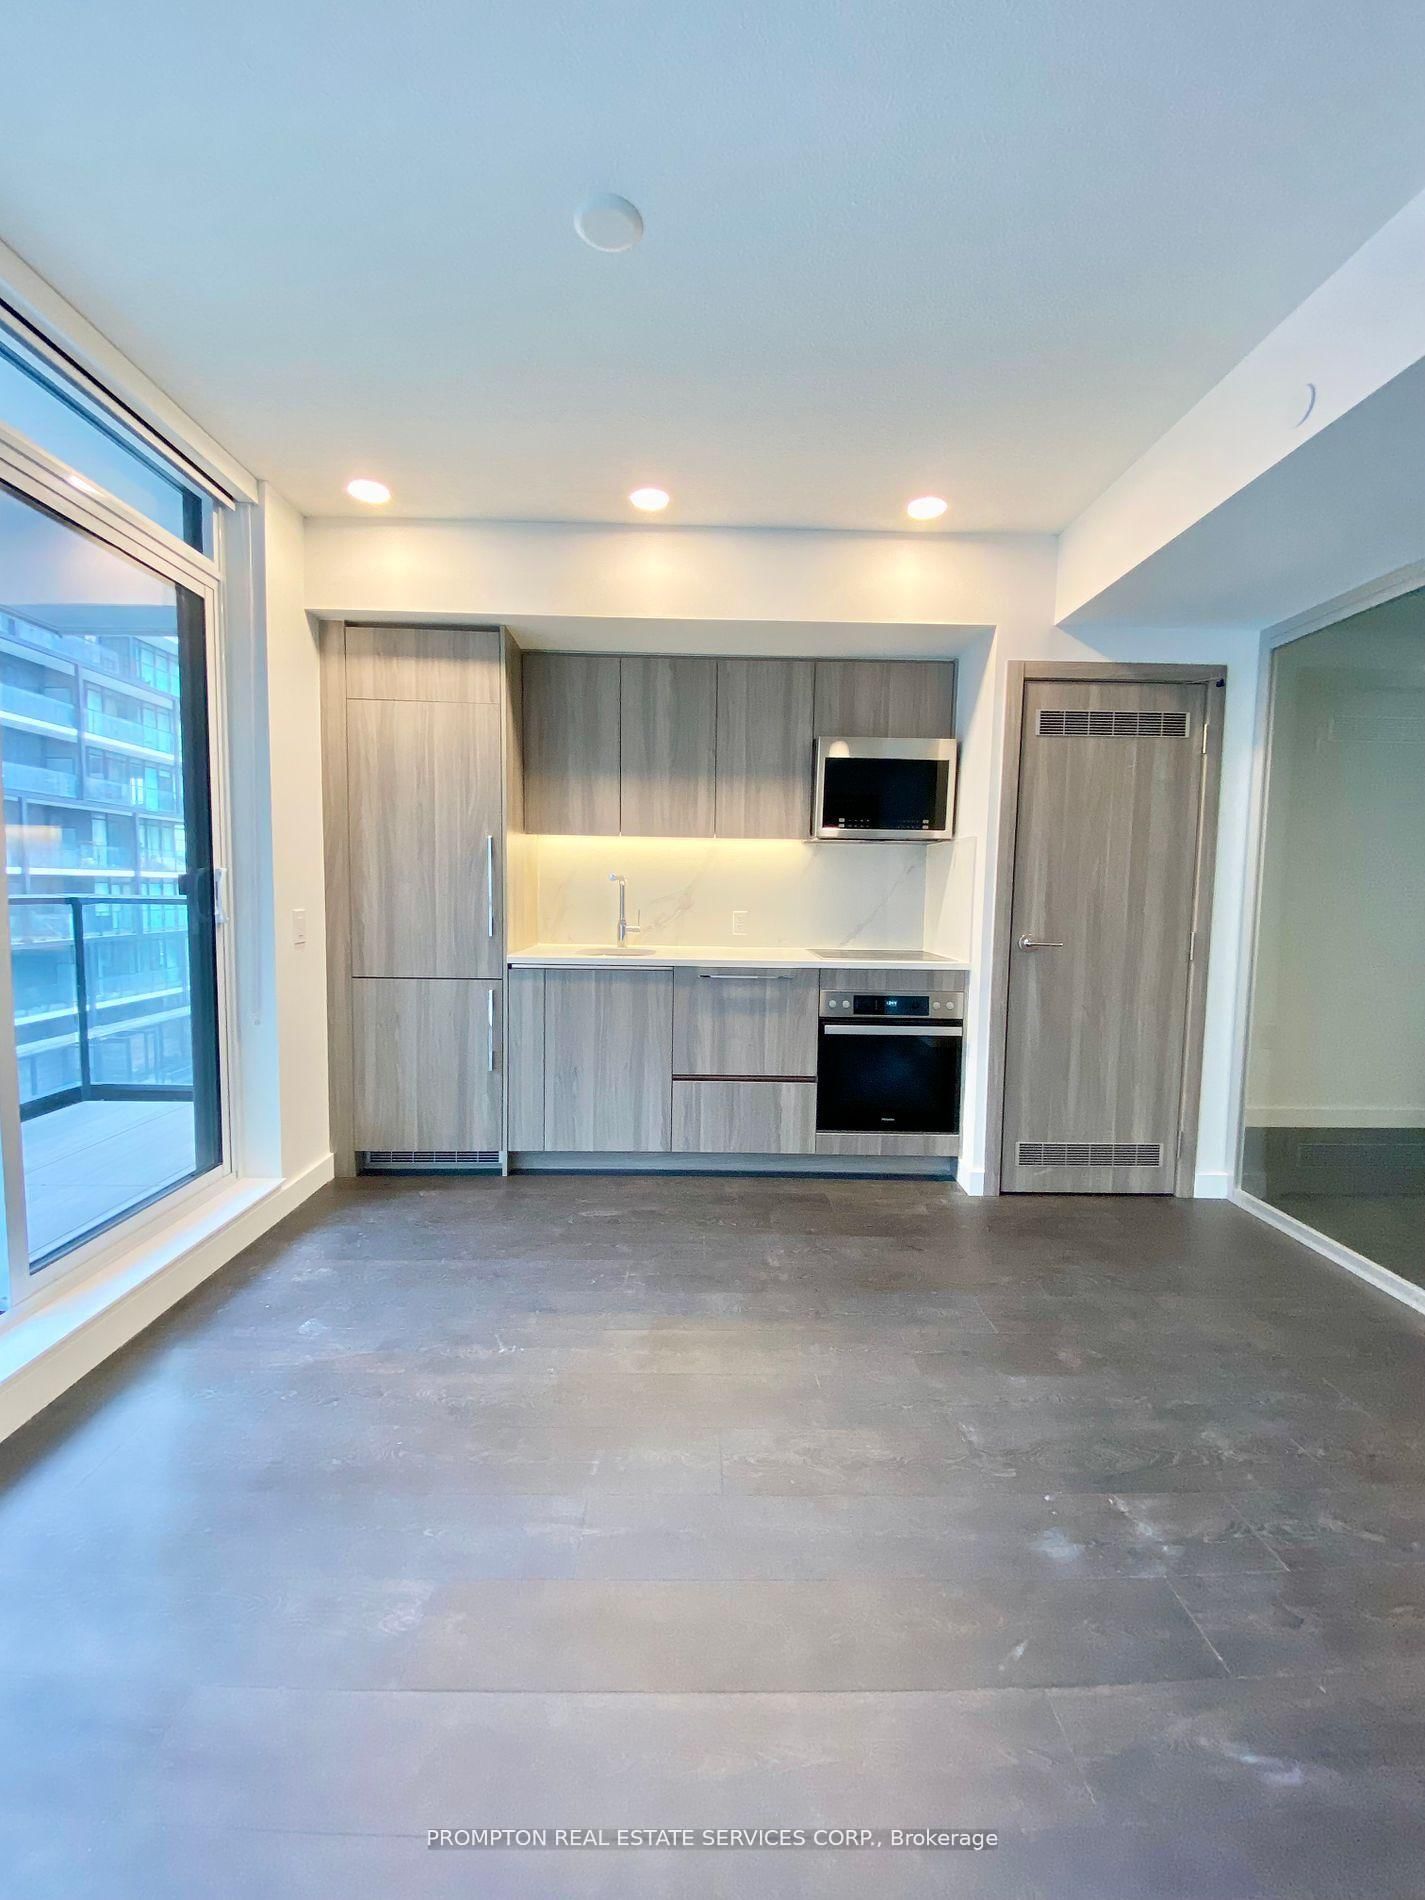
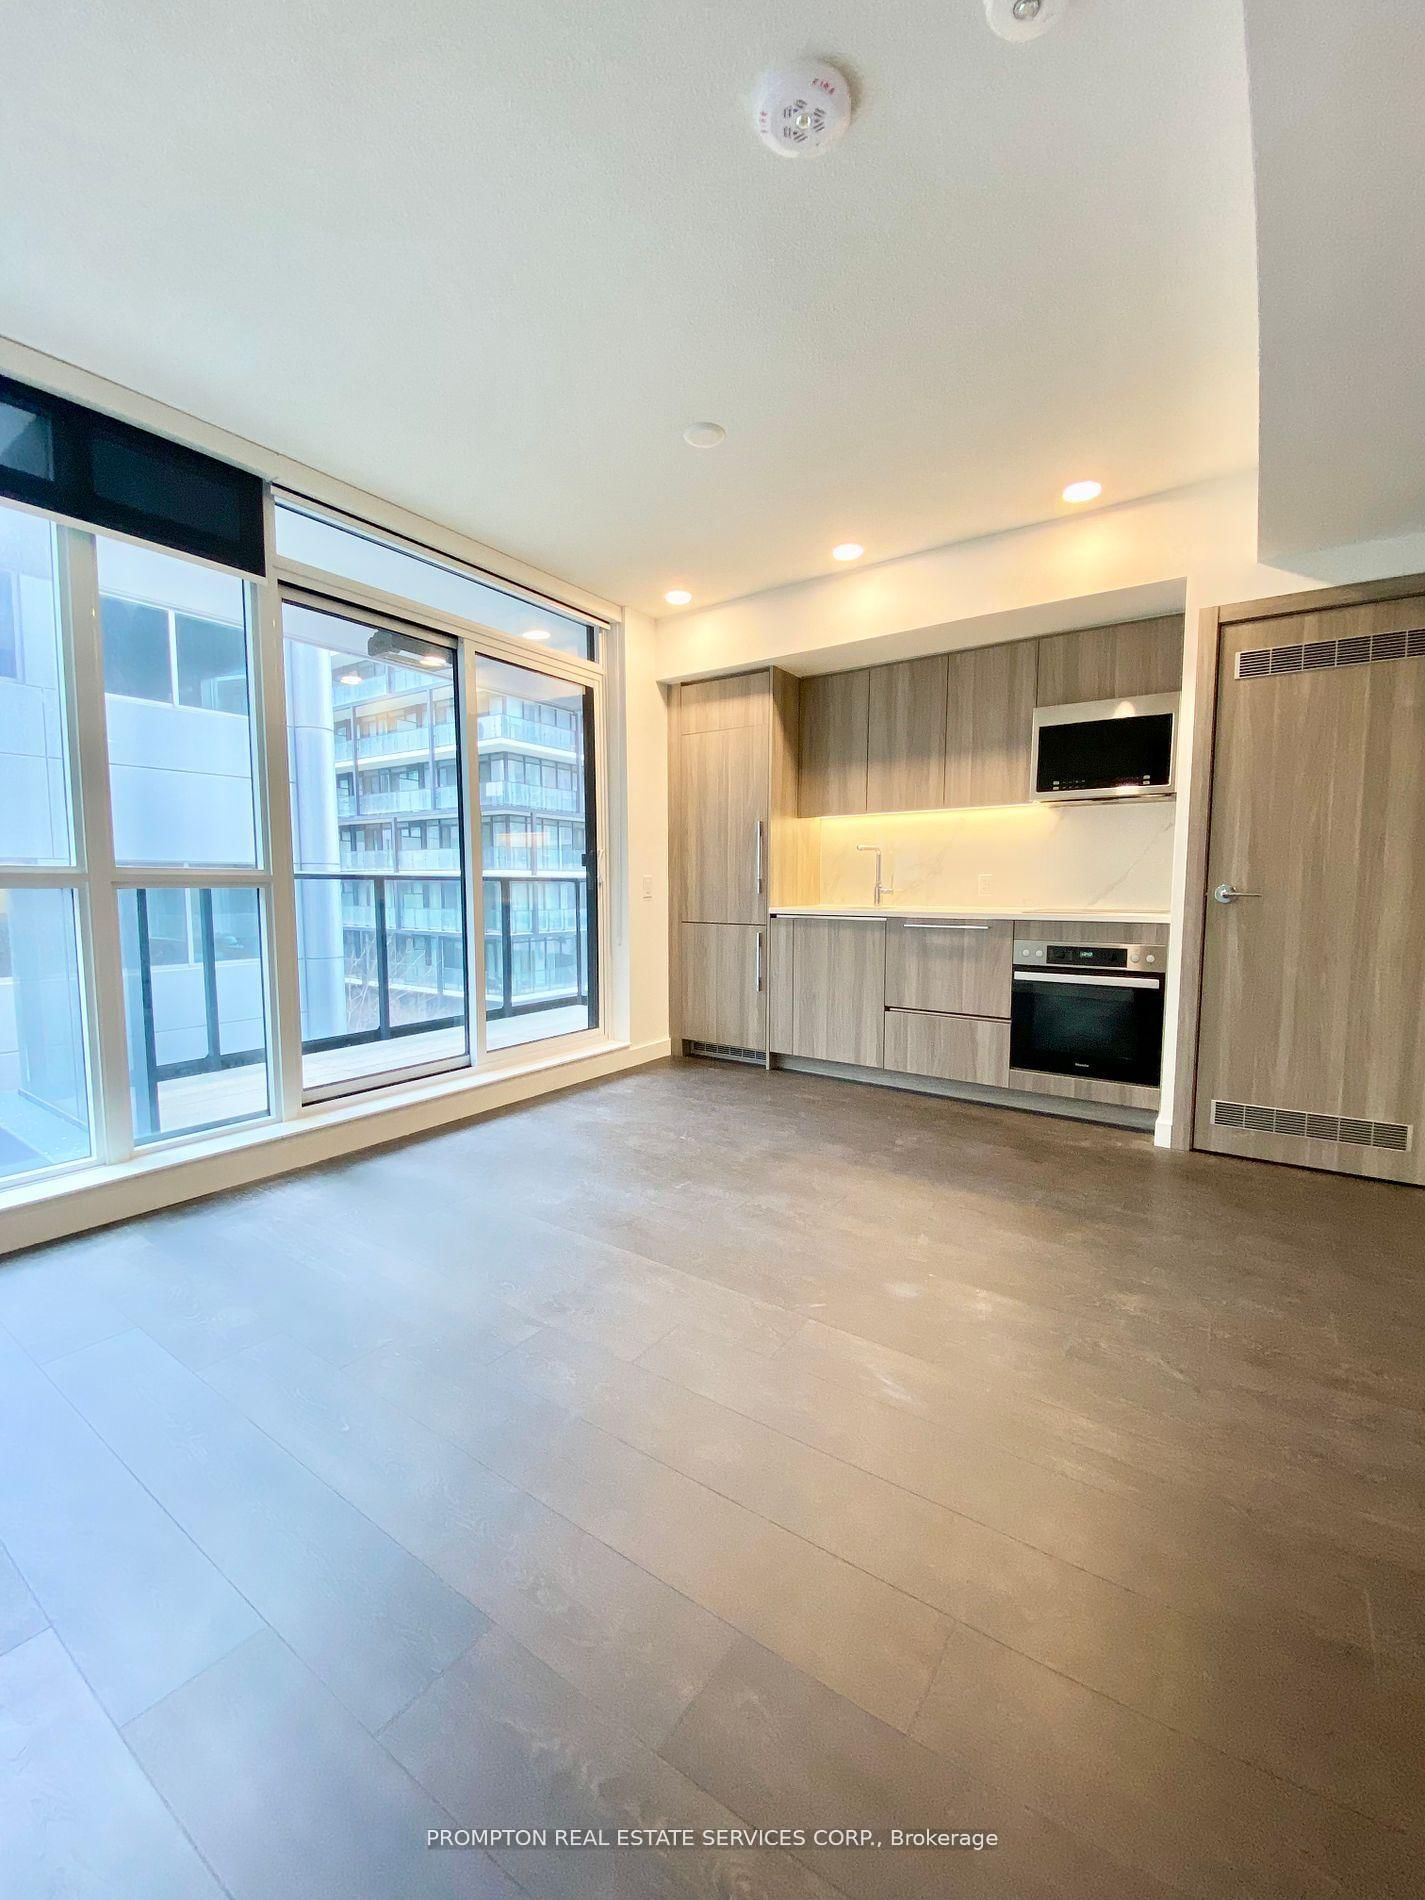
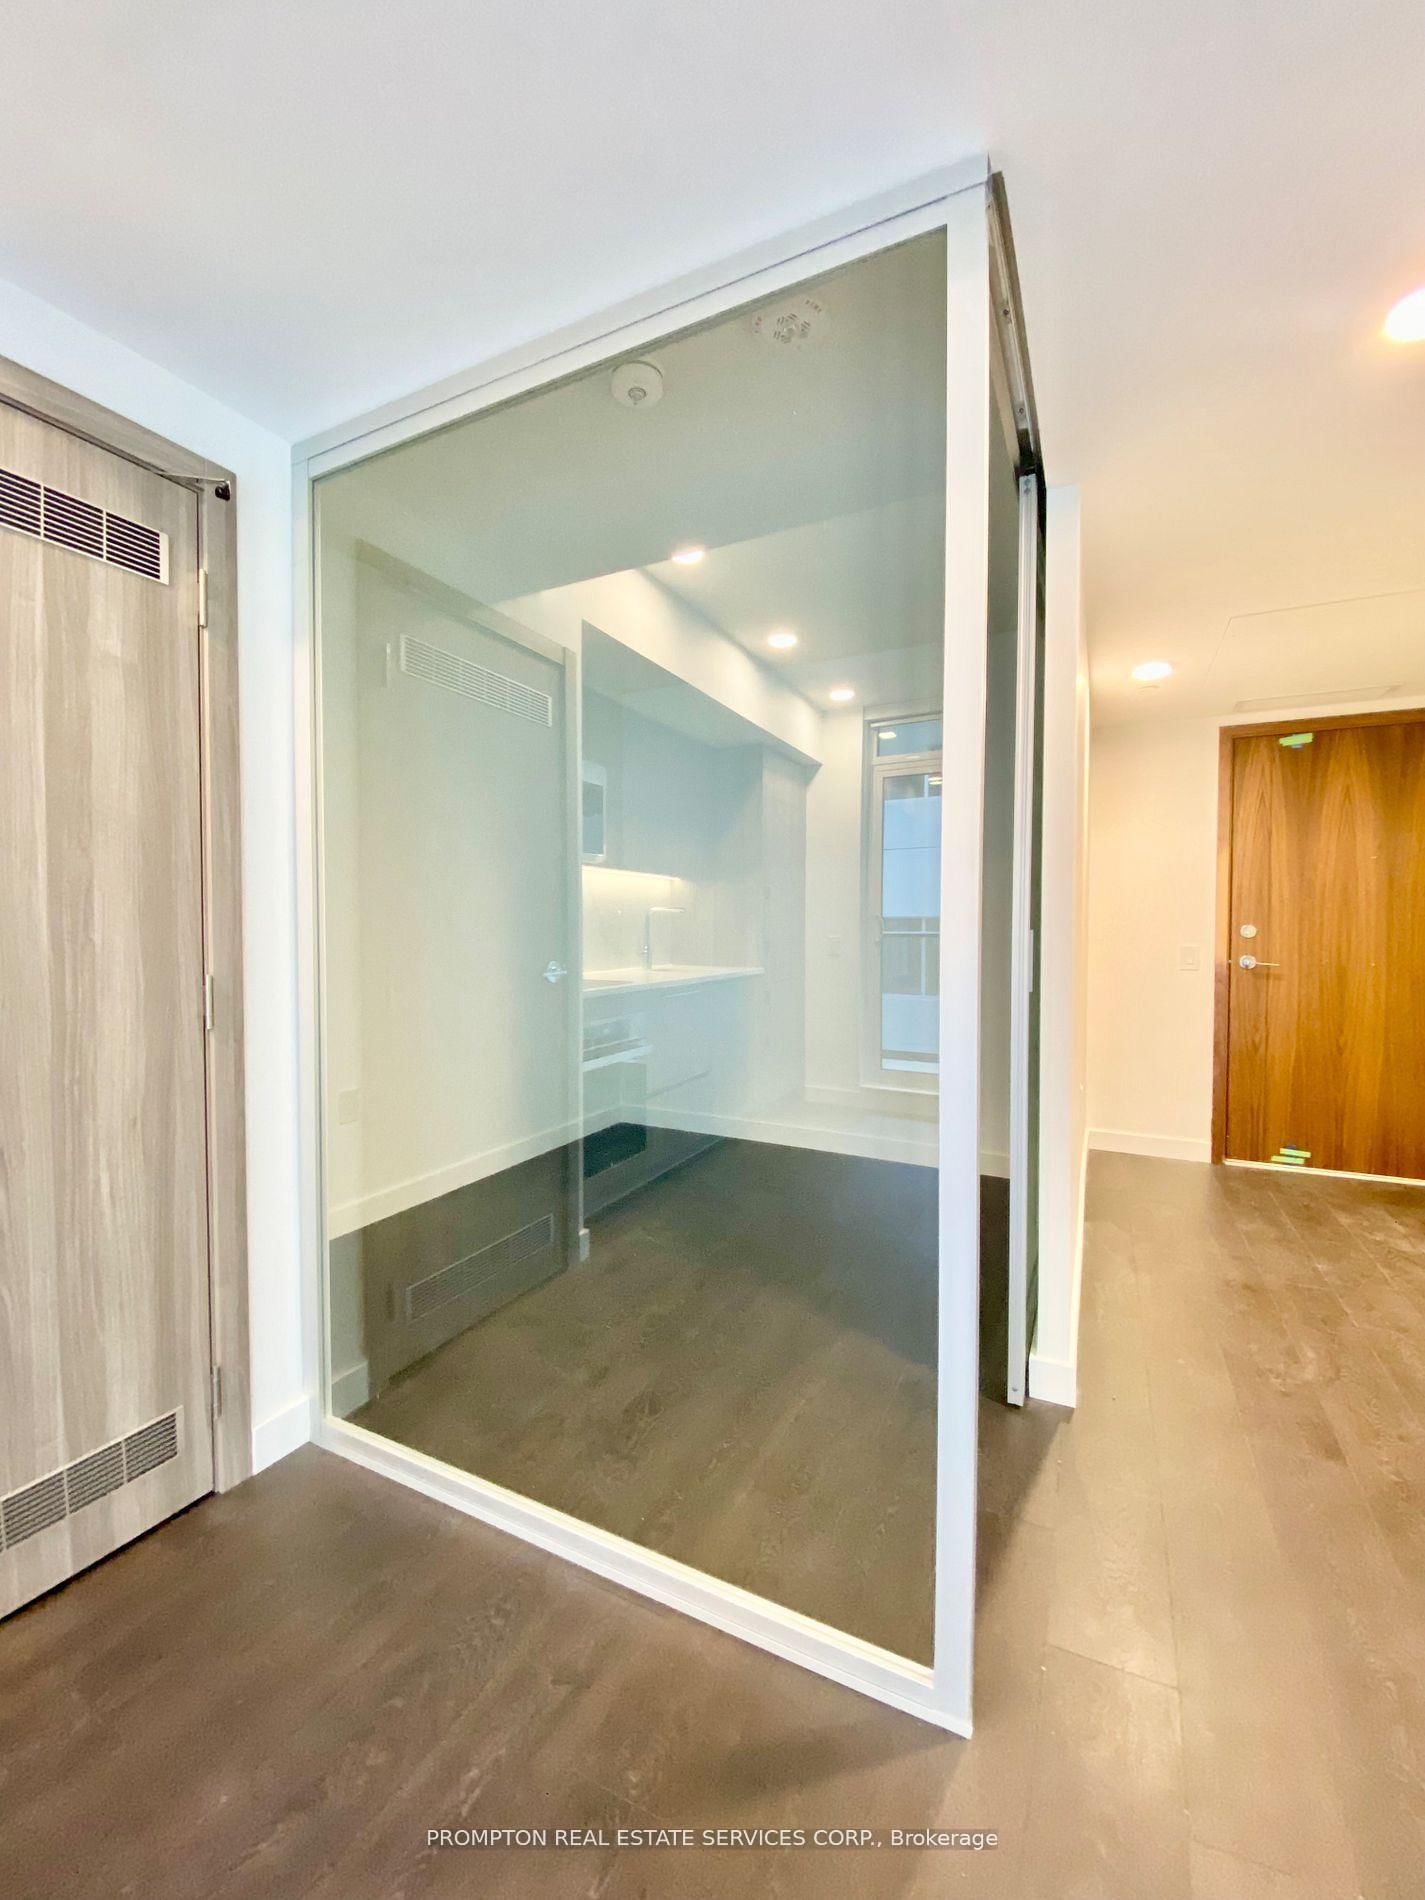
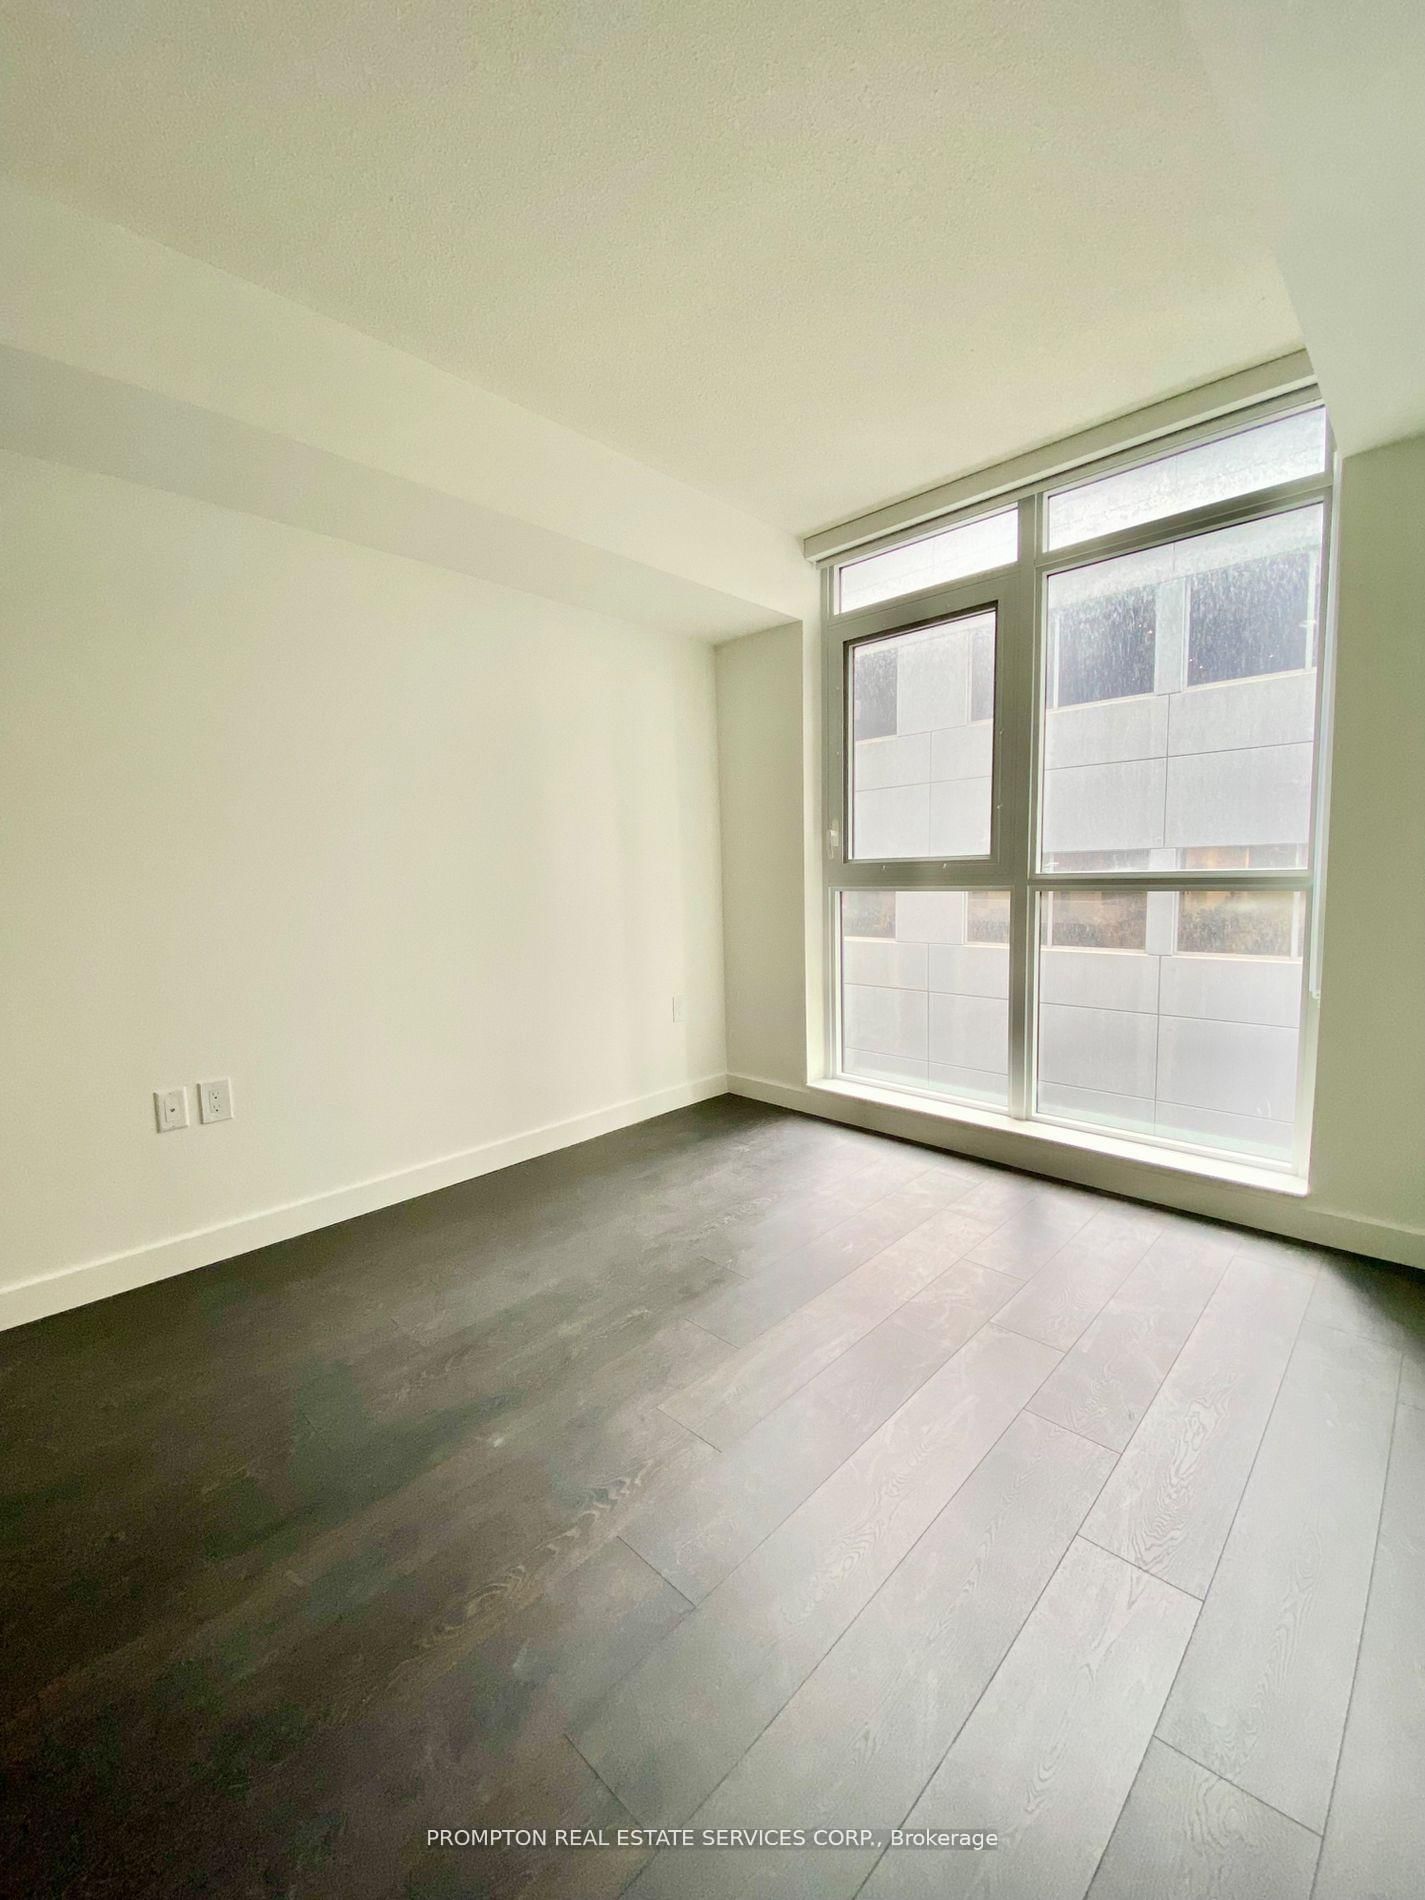
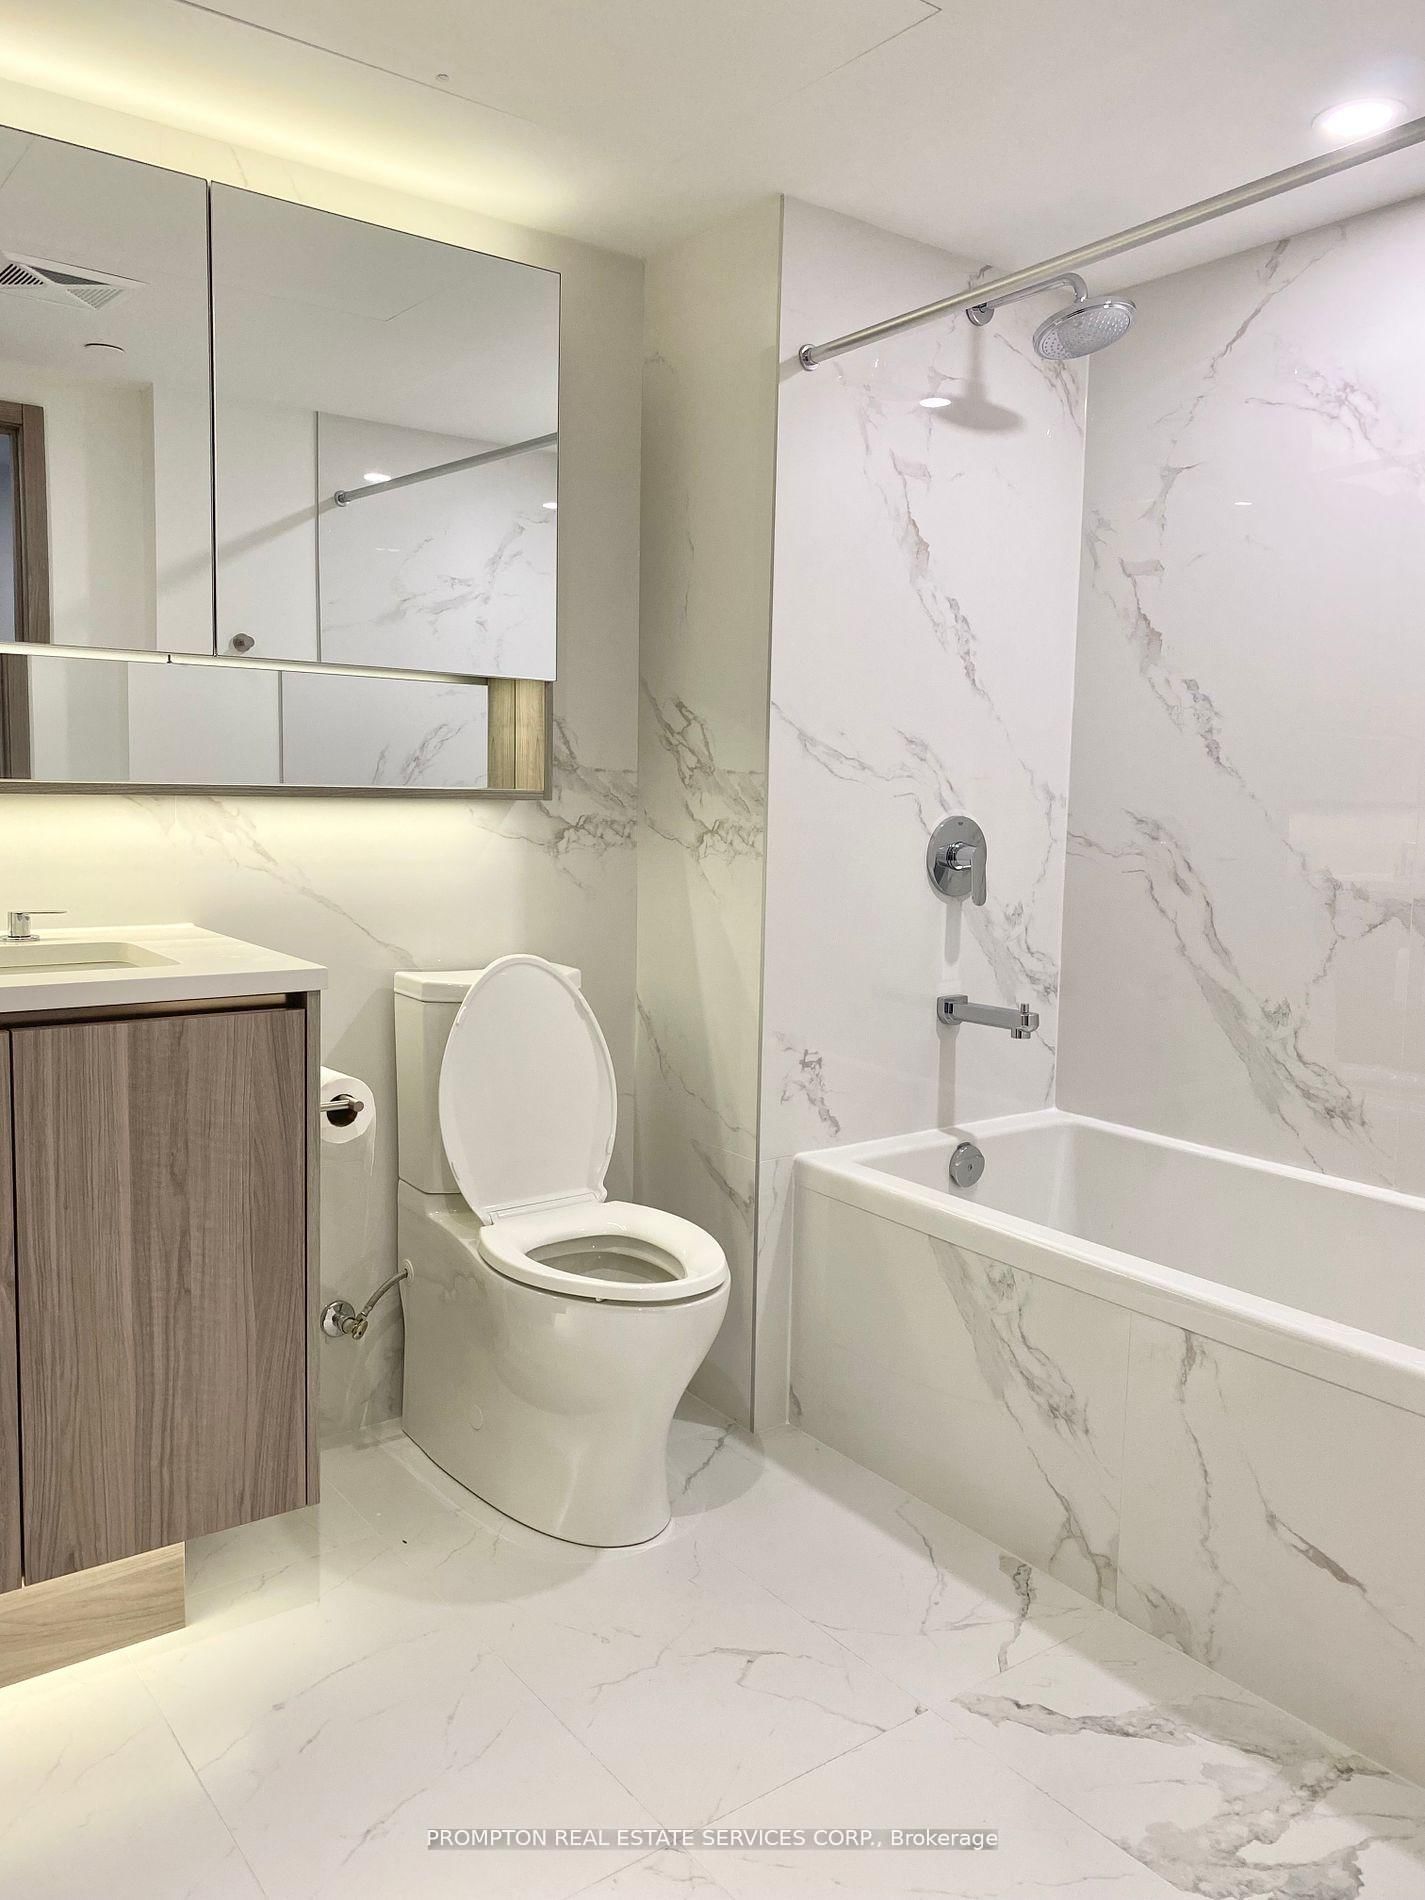
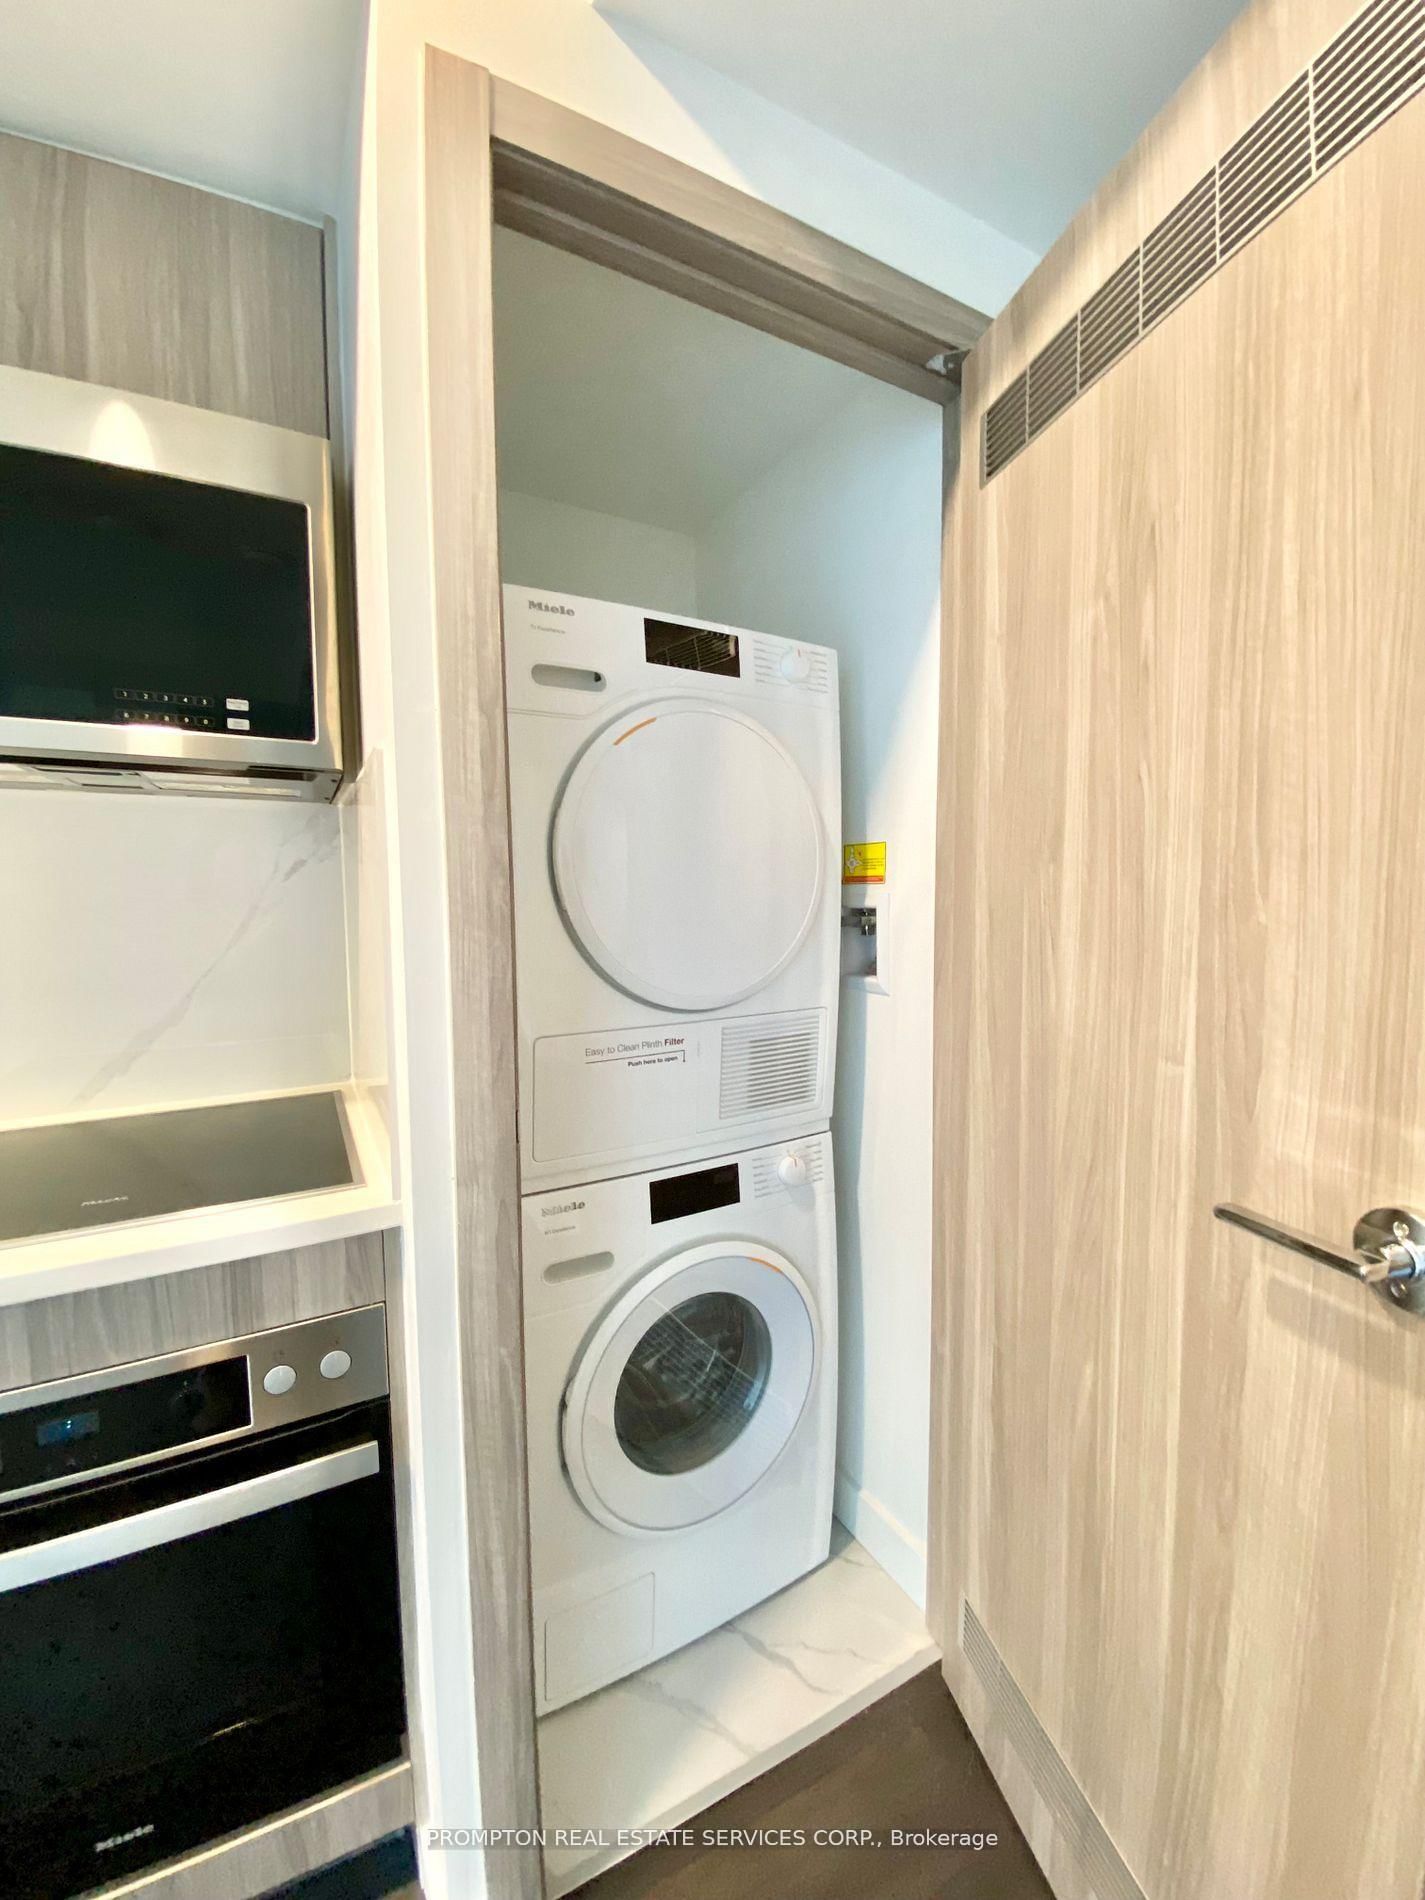
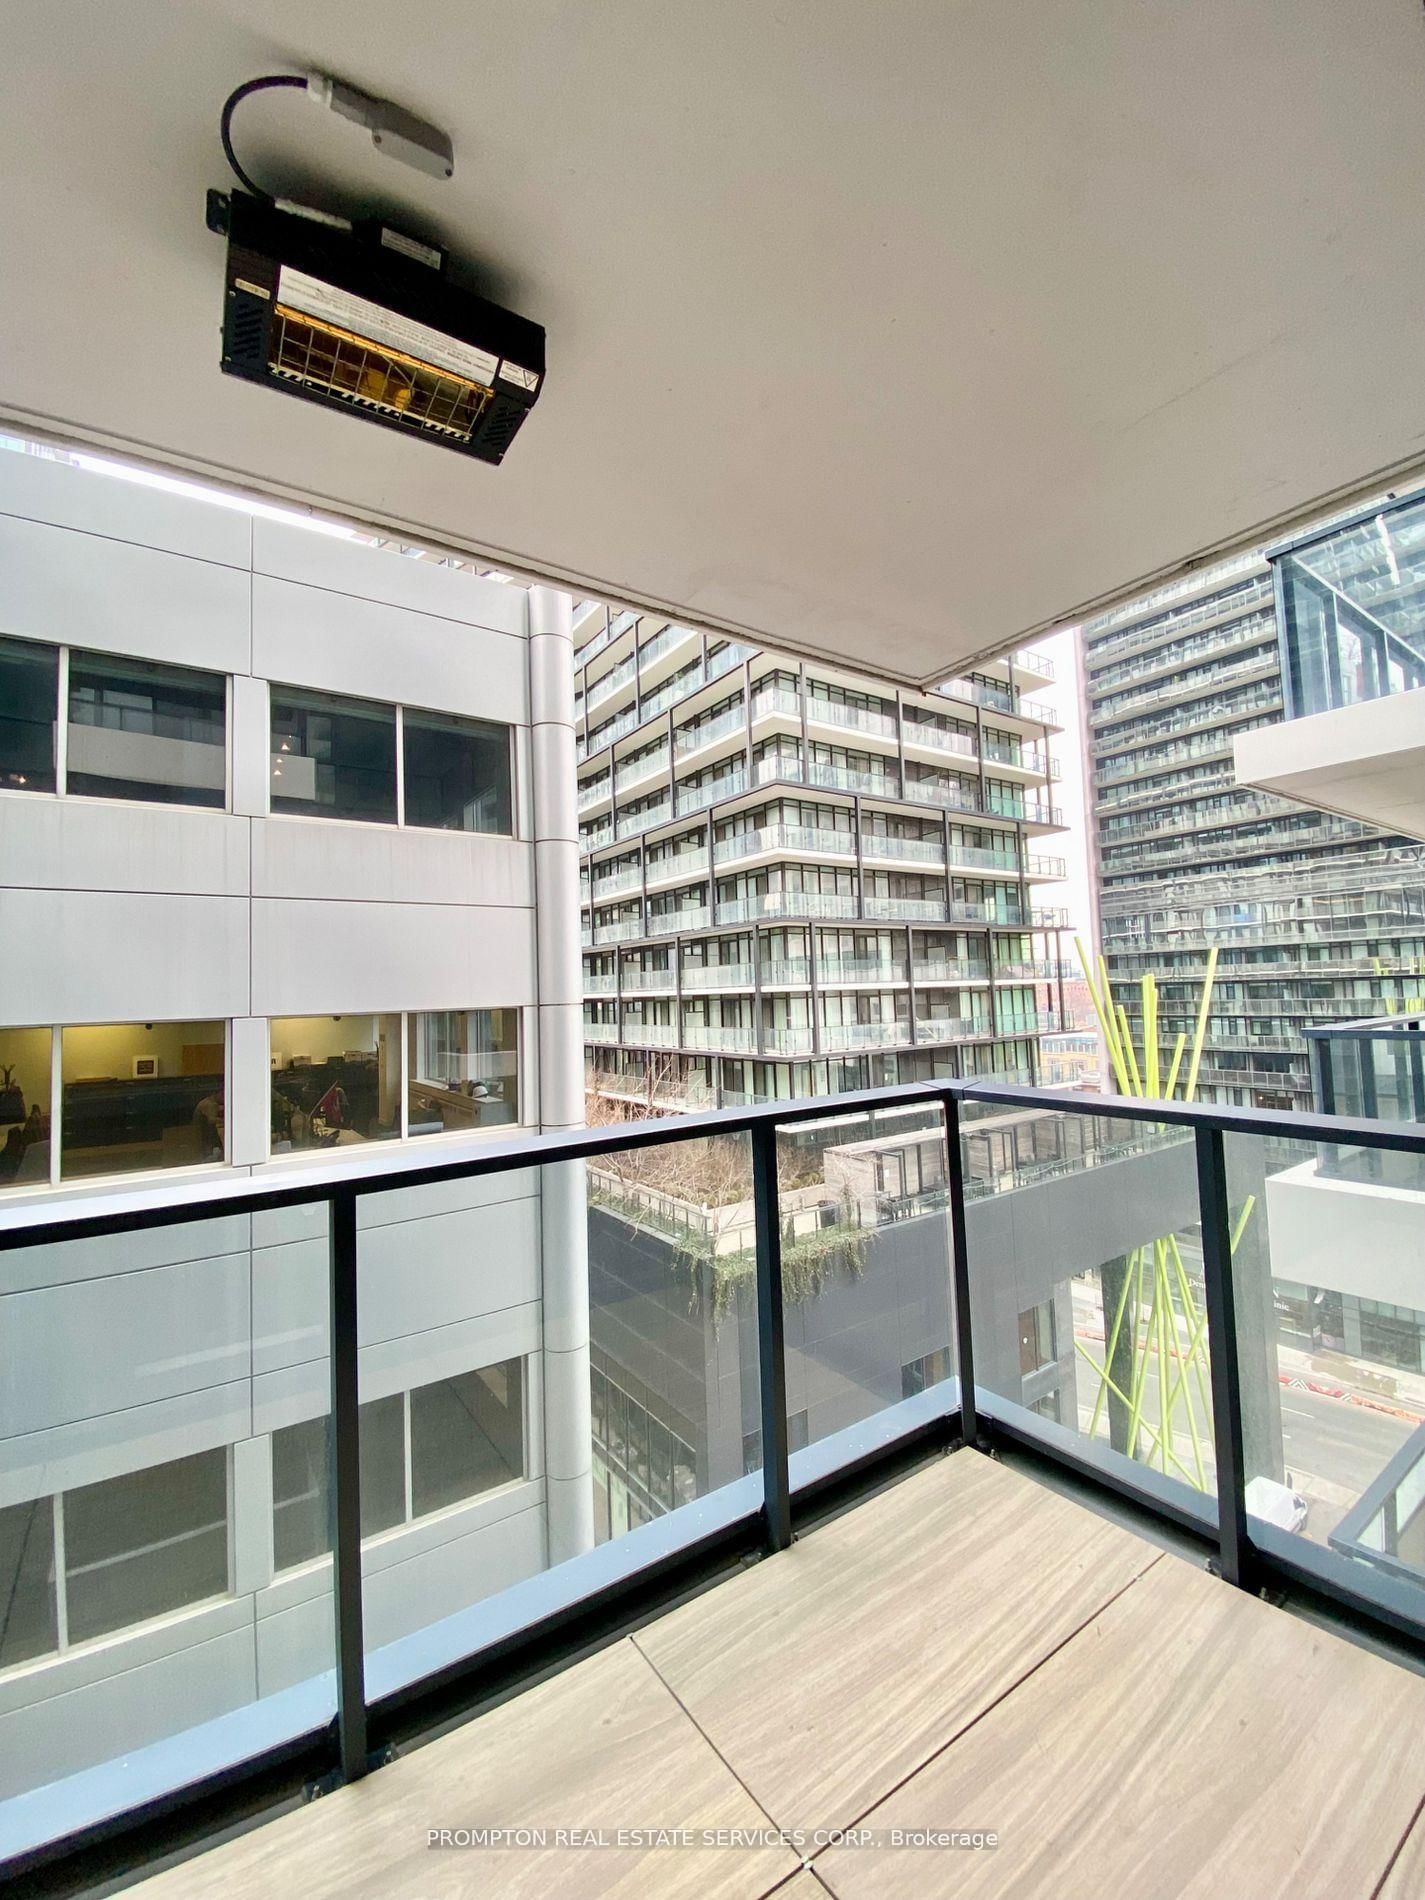
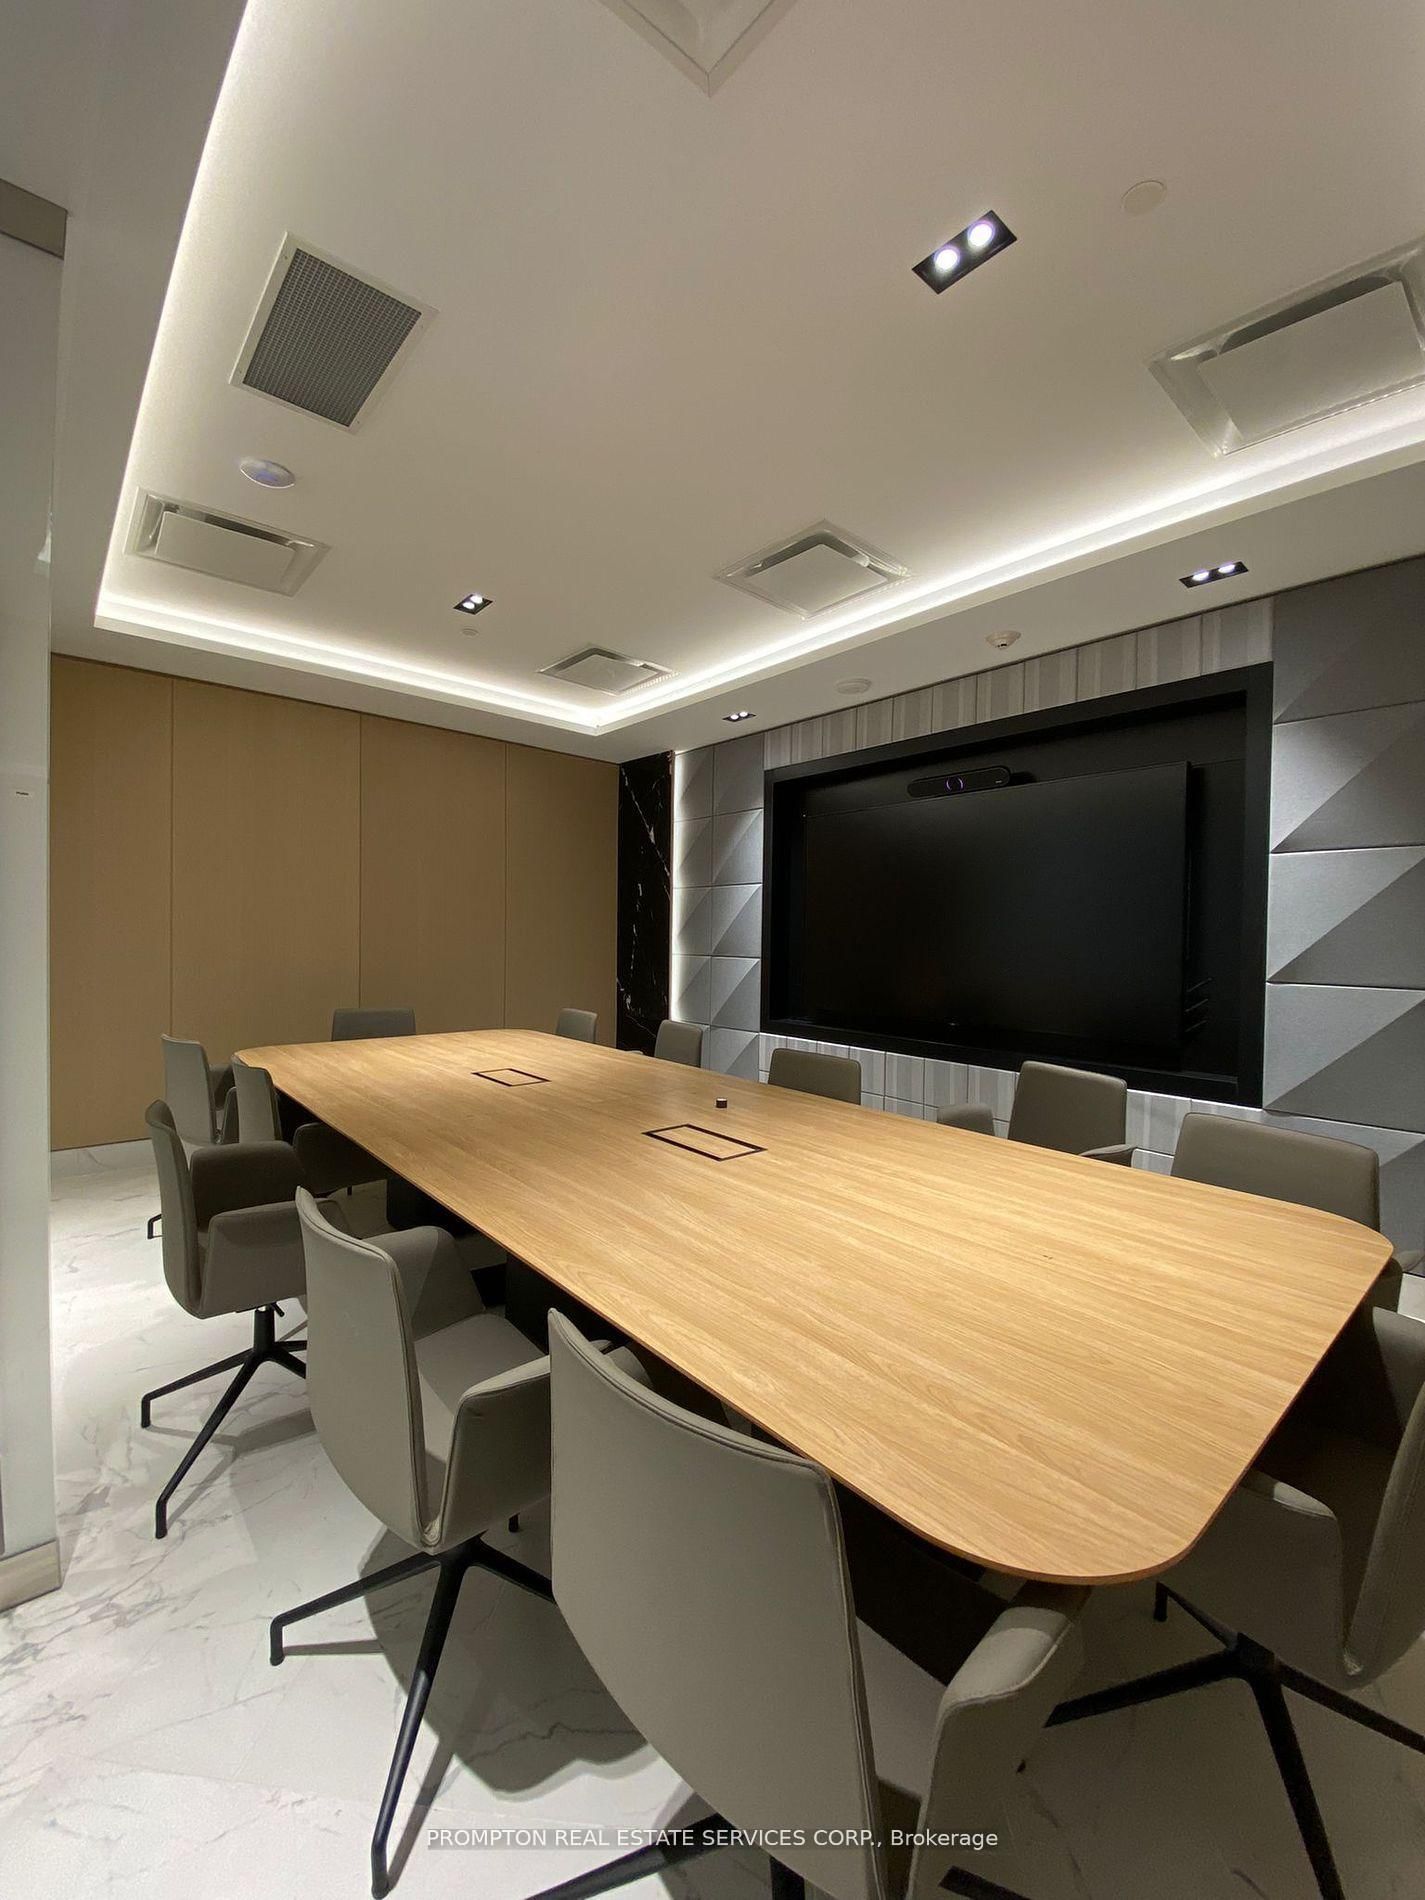
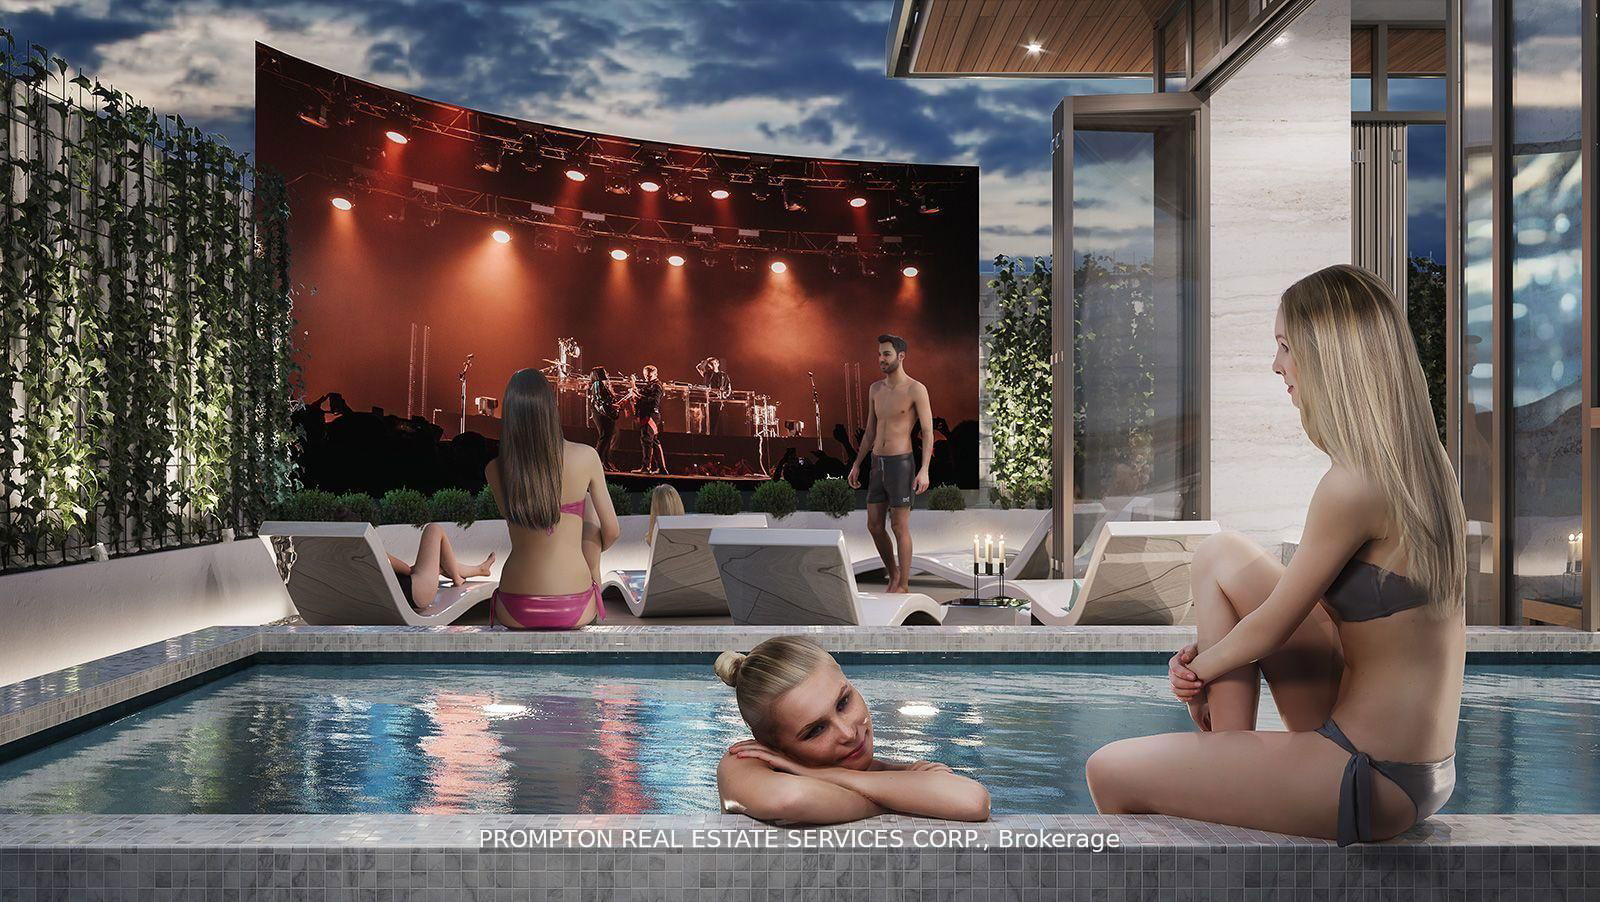
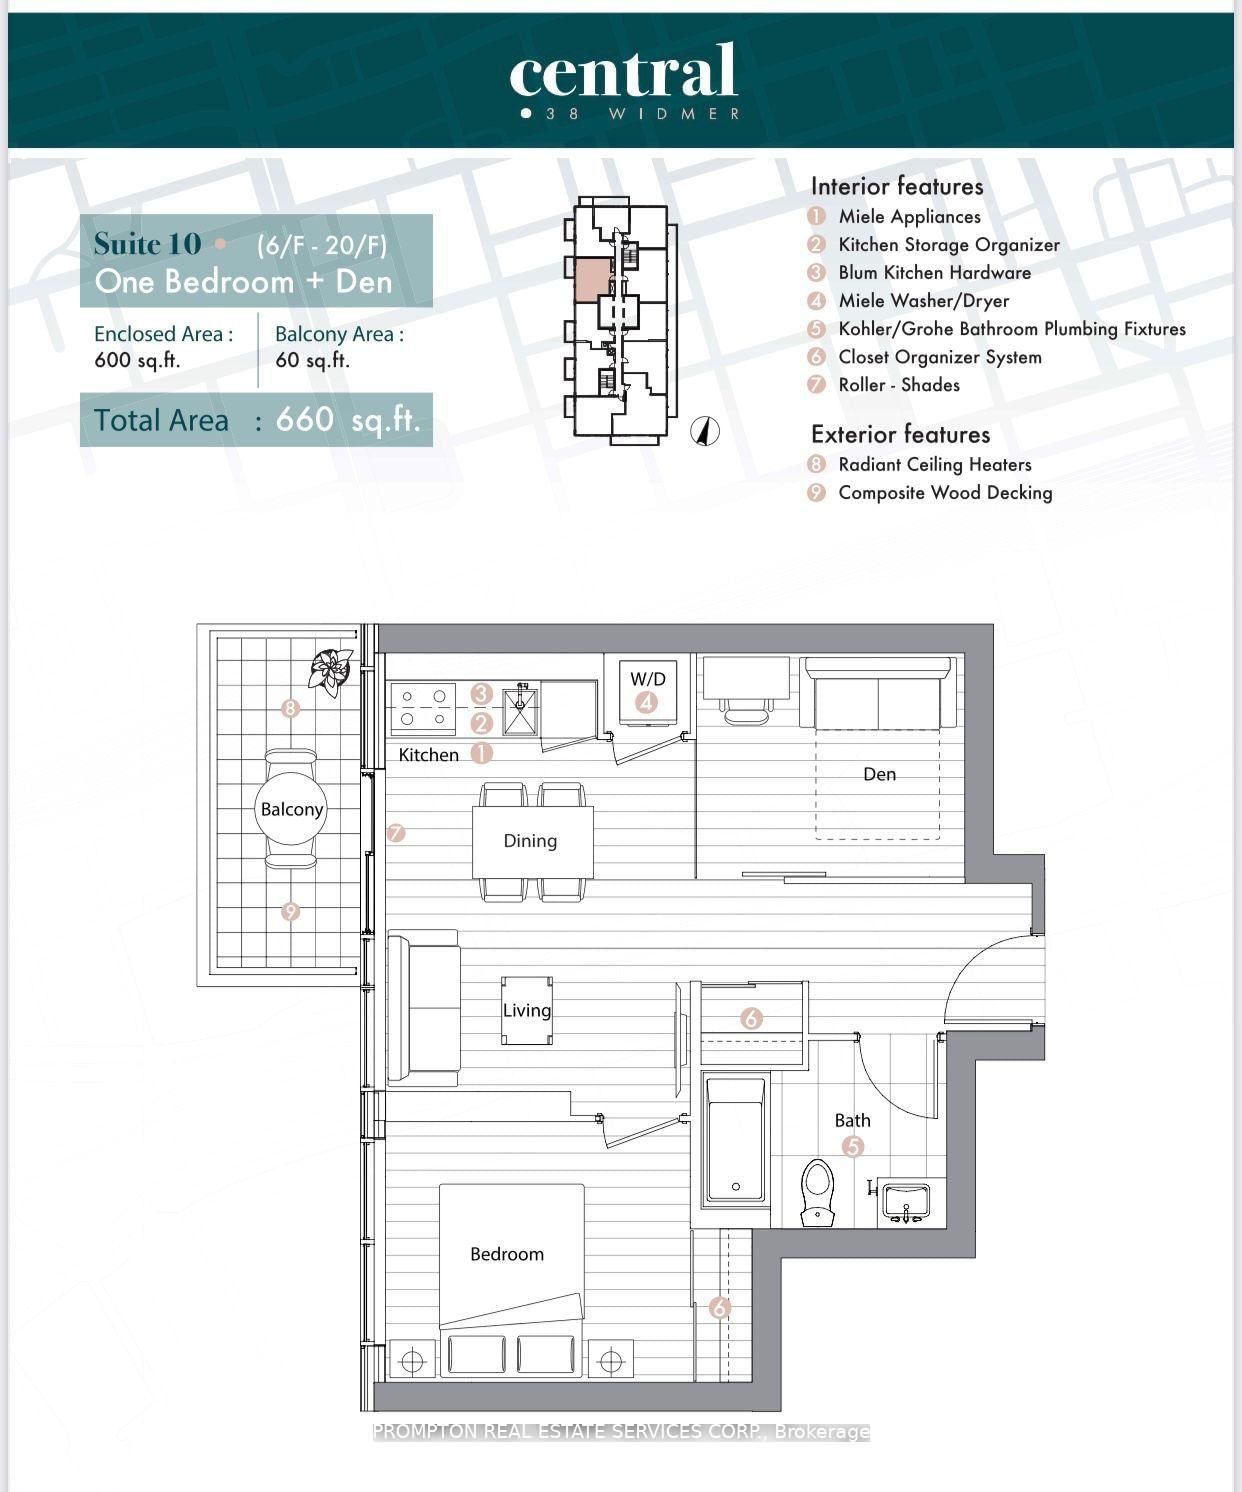
Professionally Managed 1+1 Suite, Den Can Be 2nd Bedroom. Urban Luxury Living In This High-Tech Downtown Condo, Where Cutting-Edge Design Meets Unparalleled Convenience. Featuring 100% Wifi Connectivity, State-Of-The-Art Conference Rooms, Wireless Charging Stations, NFC Building Entry, Smart Thermostats, Refrigerated Parcel Storage, Just To Name A Few. Contemporary Interior Featuring Large windows, Gourmet Chef's Kitchen With Miele Appliances, Spa-Inspired Bathroom, Private Balcony With Composite Flooring And Radiant Ceiling Heater. Prime Downtown Location, Walking Distance To Restaurants, TTC And Many More!
Extrasincludes heat and water. Tenant is responsible for hydro & tenant insurance.
prompton real estate services corp.MLS® #C12021401
Features
Utilities Included
Utility Type
- Air Conditioning
- Central Air
- Heat Source
- No Data
- Heating
- Forced Air
Amenities
Room Dimensions
Building Spotlight
Similar Listings
Explore Queen West
Commute Calculator

Demographics
Based on the dissemination area as defined by Statistics Canada. A dissemination area contains, on average, approximately 200 – 400 households.
Building Trends At Central Condos
Days on Strata
List vs Selling Price
Offer Competition
Turnover of Units
Property Value
Price Ranking
Sold Units
Rented Units
Best Value Rank
Appreciation Rank
Rental Yield
High Demand
Market Insights
Transaction Insights at Central Condos
| Studio | 1 Bed | 1 Bed + Den | 2 Bed | 3 Bed | 3 Bed + Den | |
|---|---|---|---|---|---|---|
| Price Range | No Data | $615,000 | No Data | $699,000 - $888,000 | $1,038,000 - $1,130,000 | No Data |
| Avg. Cost Per Sqft | No Data | $1,317 | No Data | $1,246 | $1,063 | No Data |
| Price Range | $2,050 - $2,250 | $1,500 - $2,450 | $2,500 - $2,700 | $2,550 - $3,800 | $2,850 - $5,200 | No Data |
| Avg. Wait for Unit Availability | No Data | 481 Days | No Data | 156 Days | 210 Days | No Data |
| Avg. Wait for Unit Availability | 103 Days | 6 Days | 23 Days | 3 Days | 11 Days | No Data |
| Ratio of Units in Building | 1% | 23% | 4% | 56% | 18% | 1% |
Market Inventory
Total number of units listed and leased in Queen West
