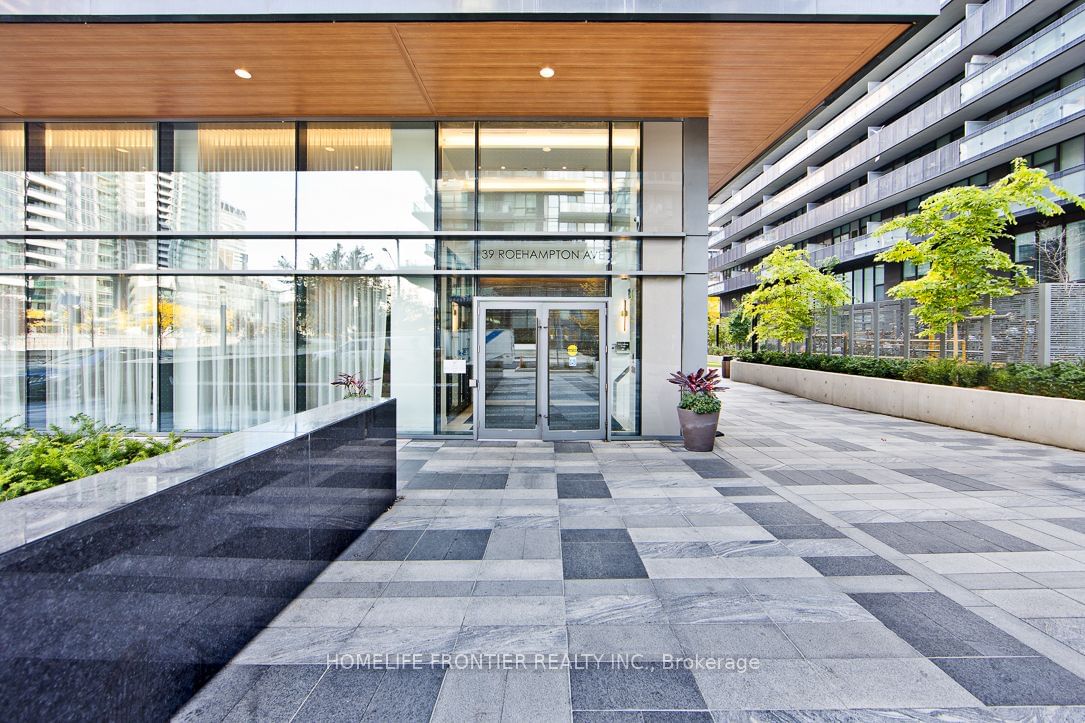
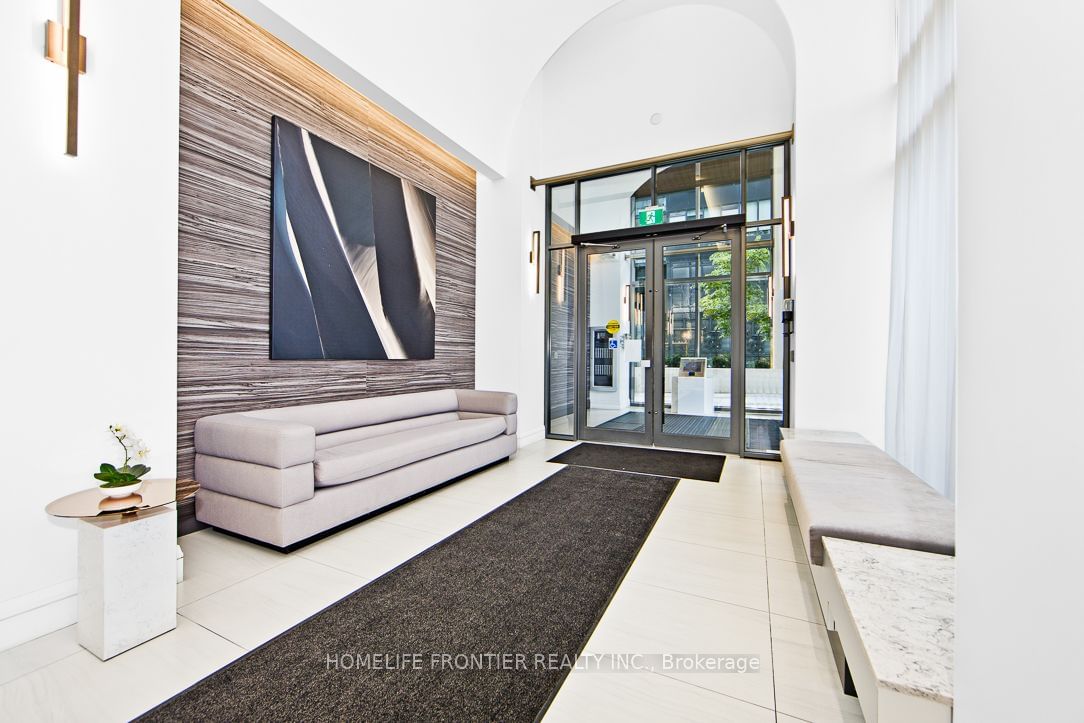
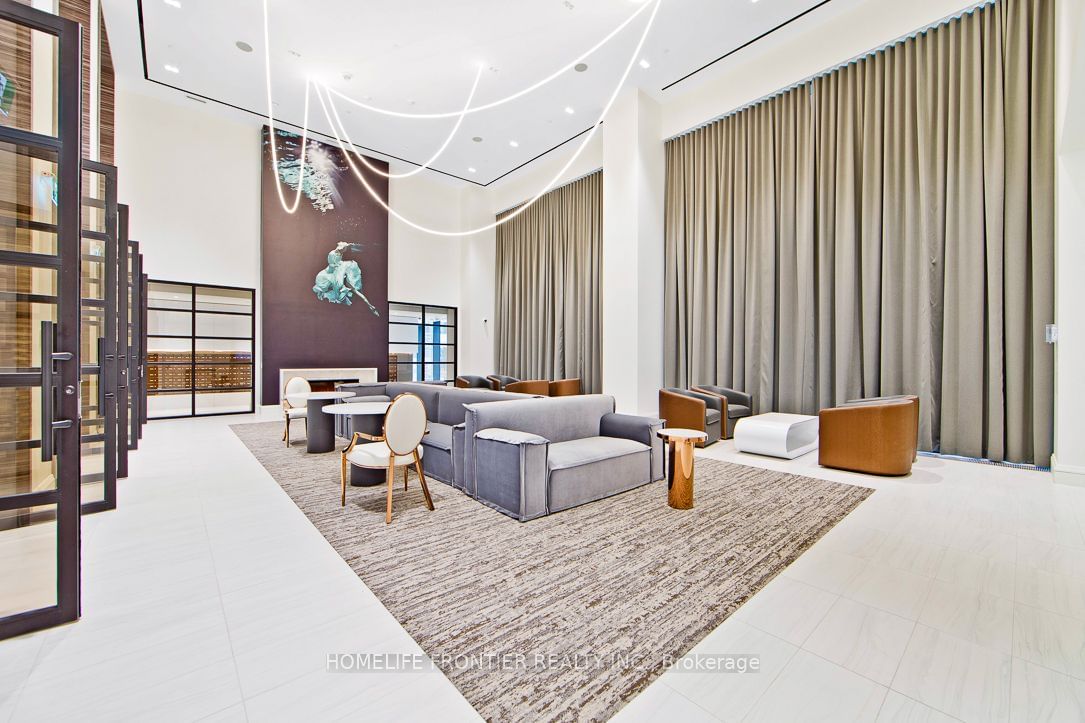
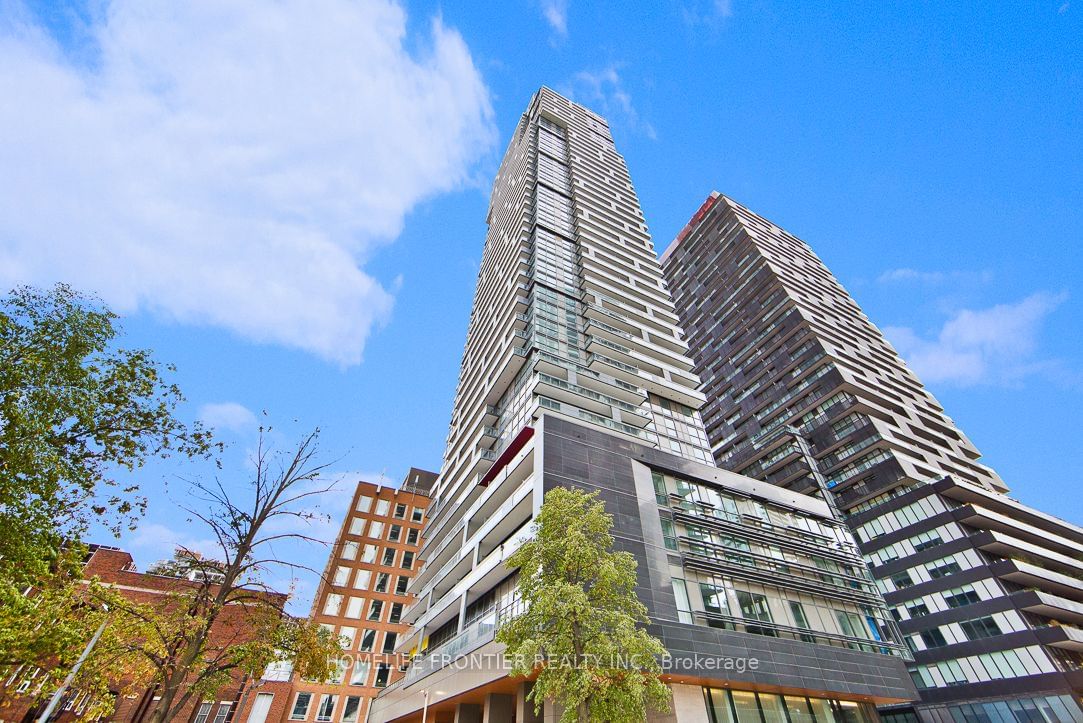
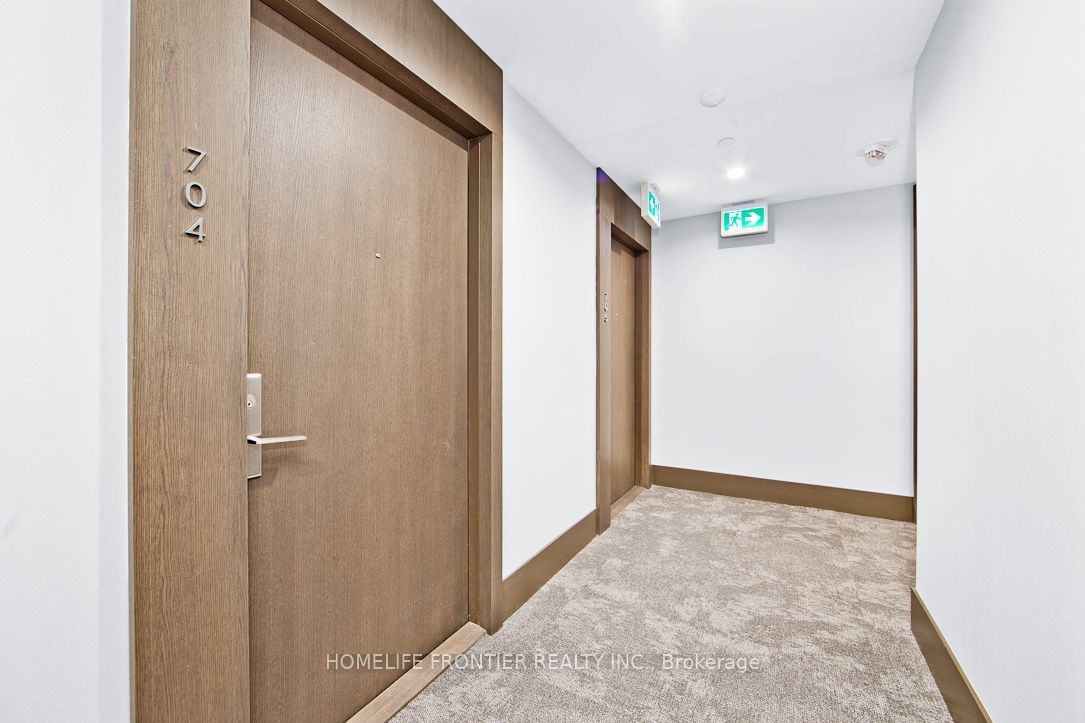
704 - 39 Roehampton Ave
Listing History
Unit Highlights
Utilities Included
Utility Type
- Air Conditioning
- Central Air
- Heat Source
- Gas
- Heating
- Forced Air
Room Dimensions
About this Listing
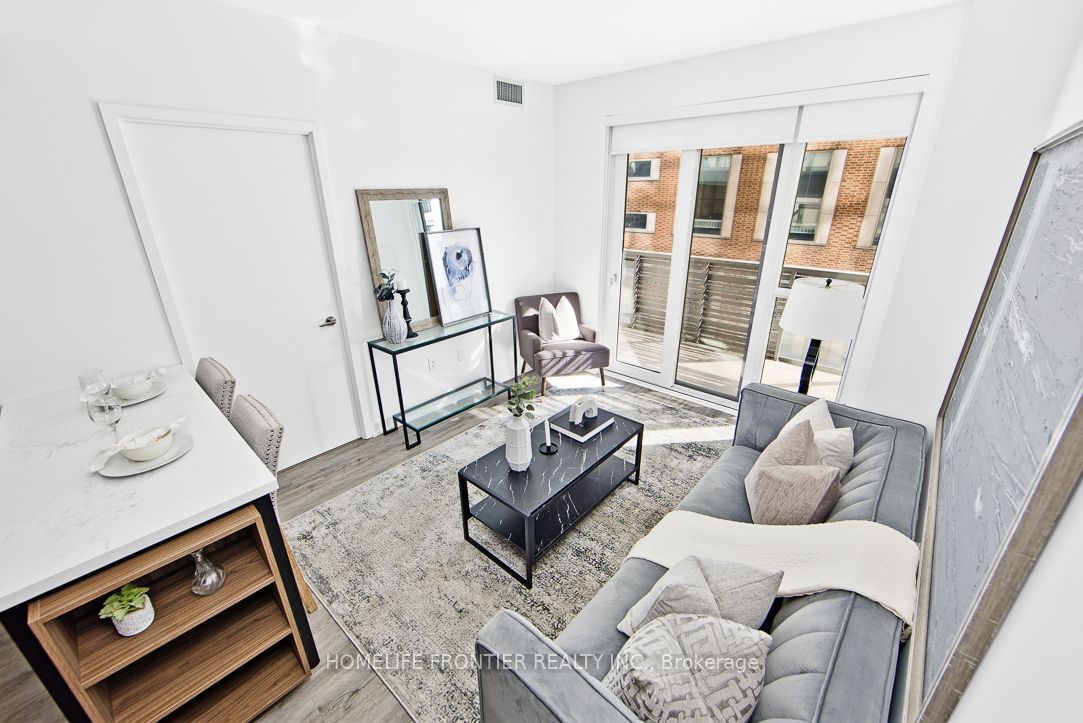
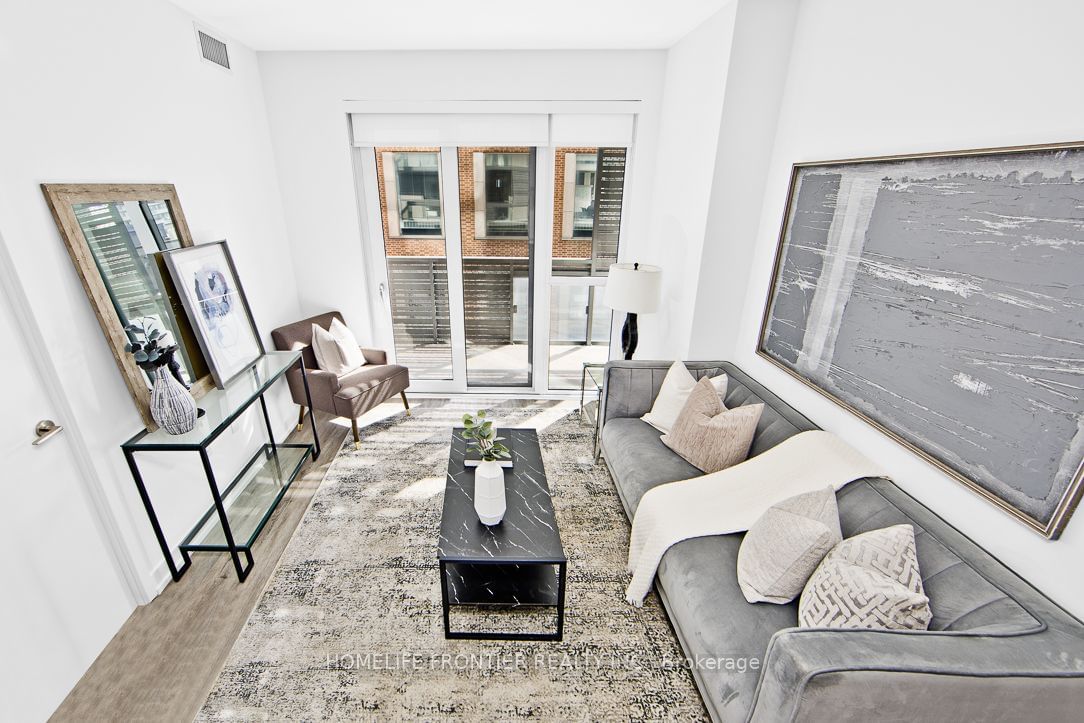
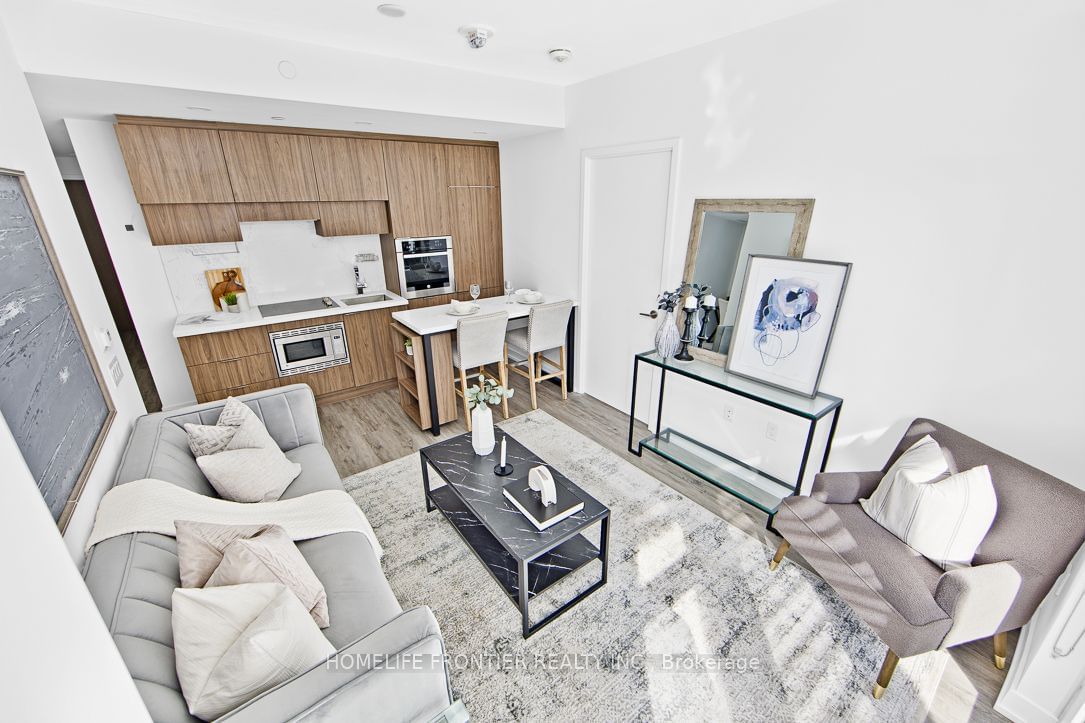
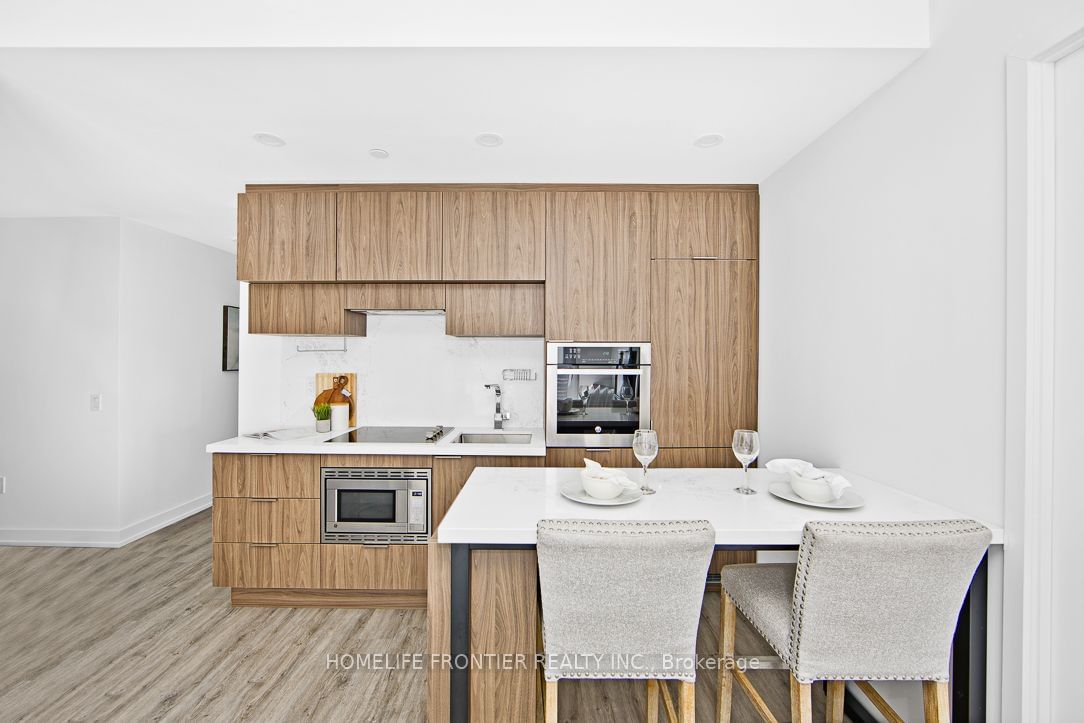
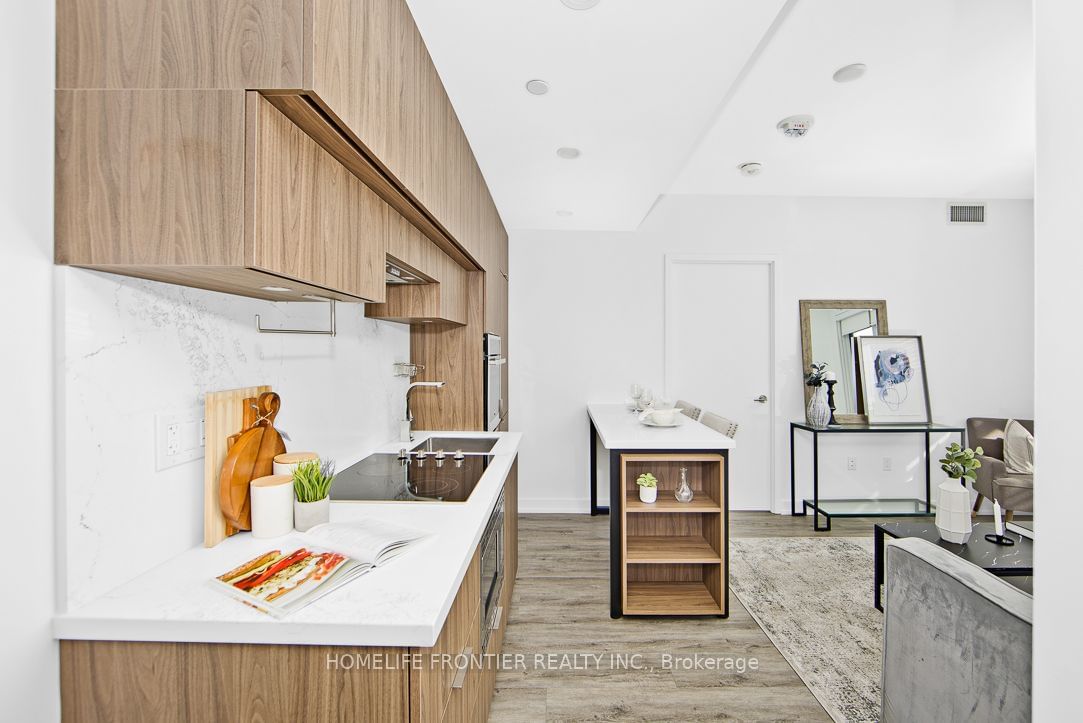
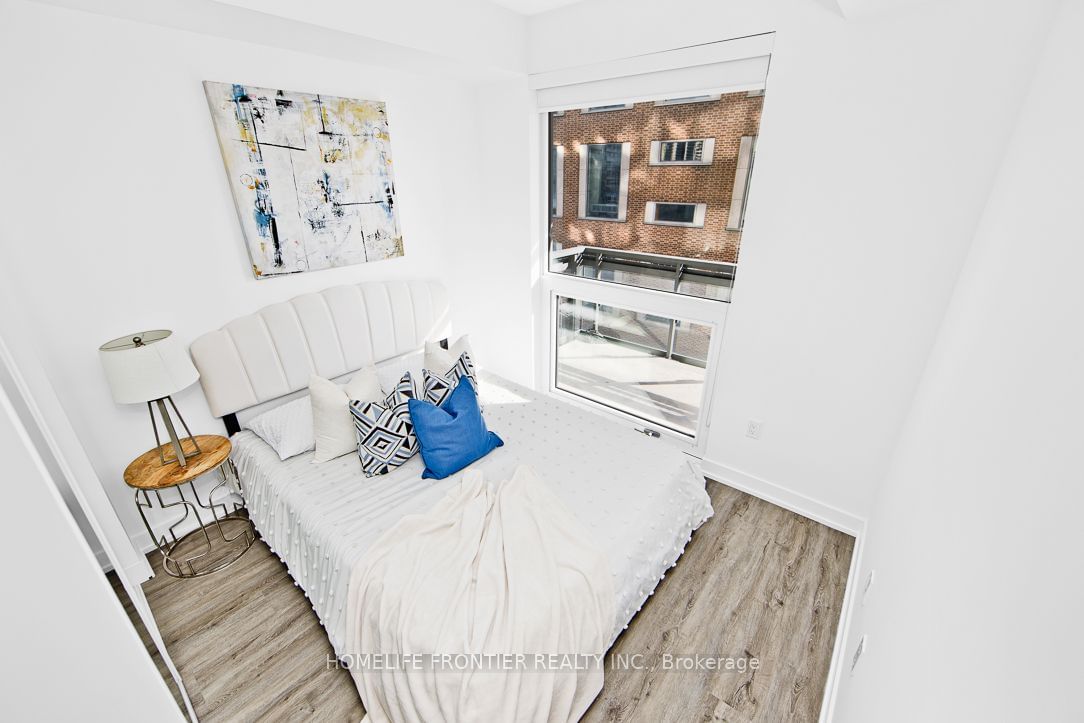
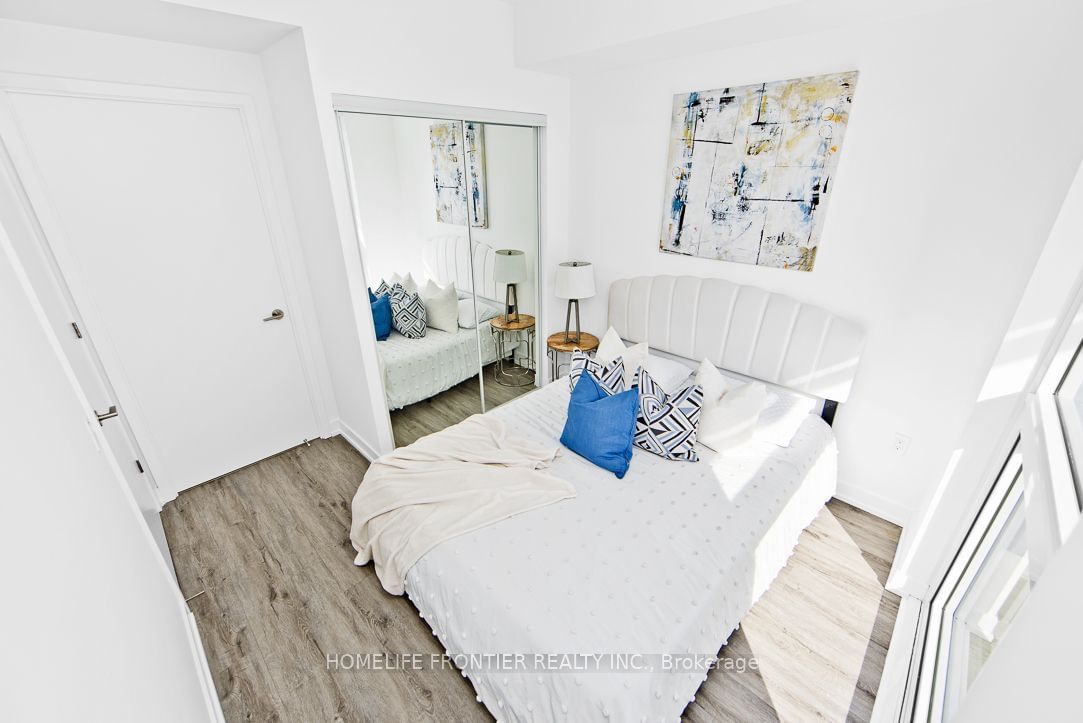
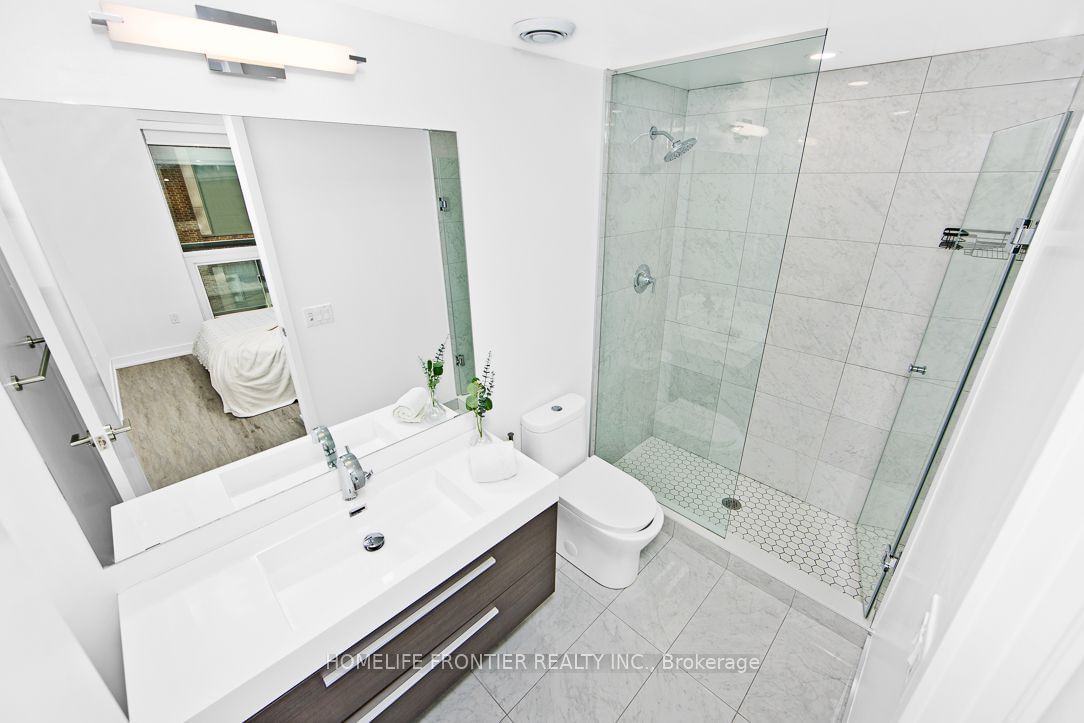
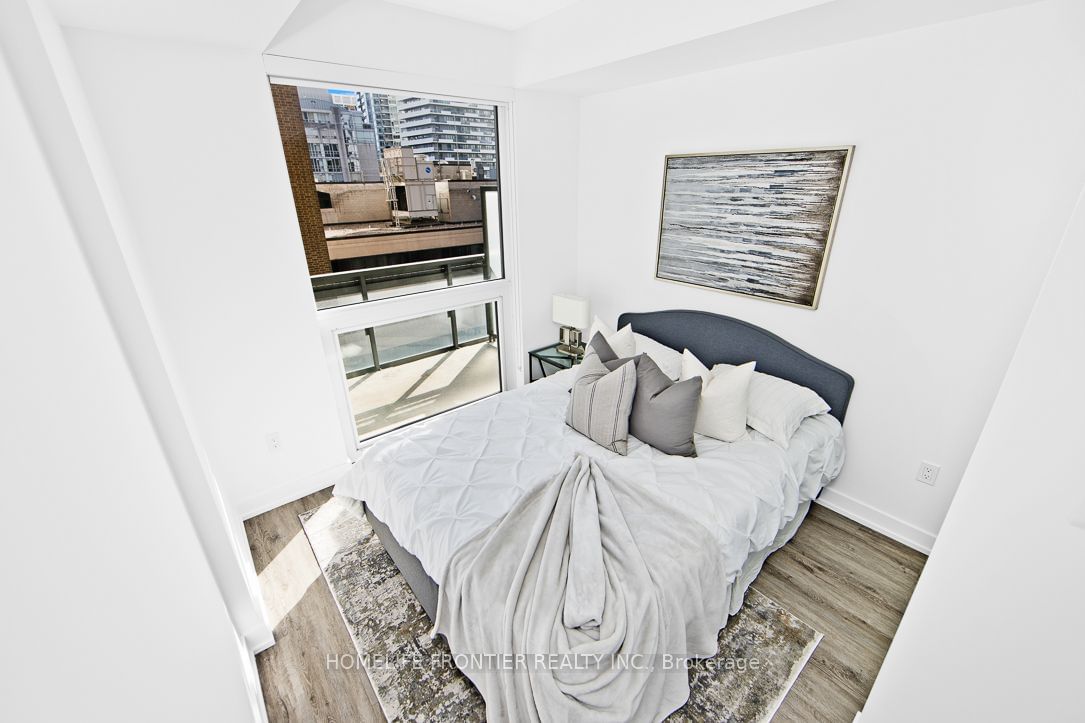
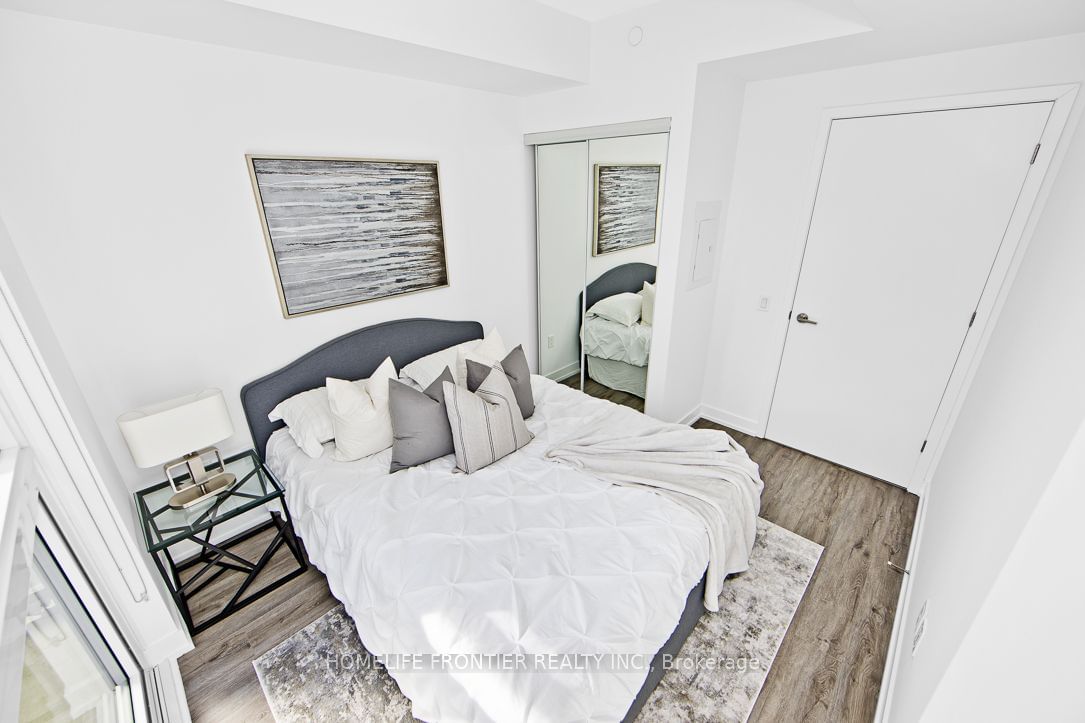
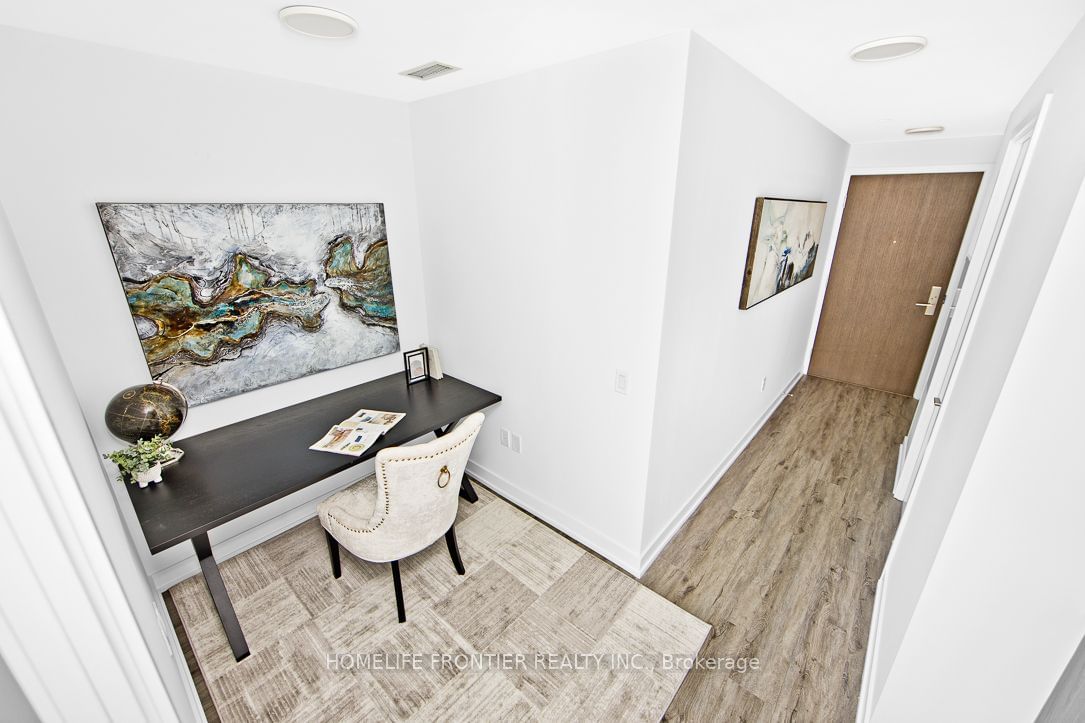
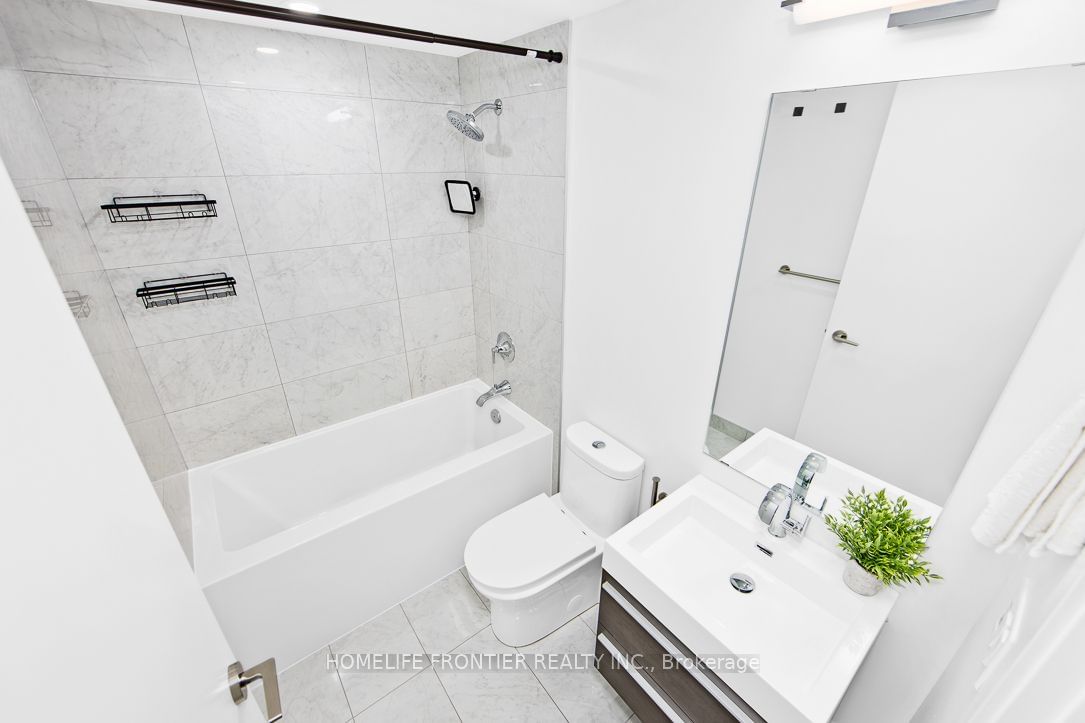
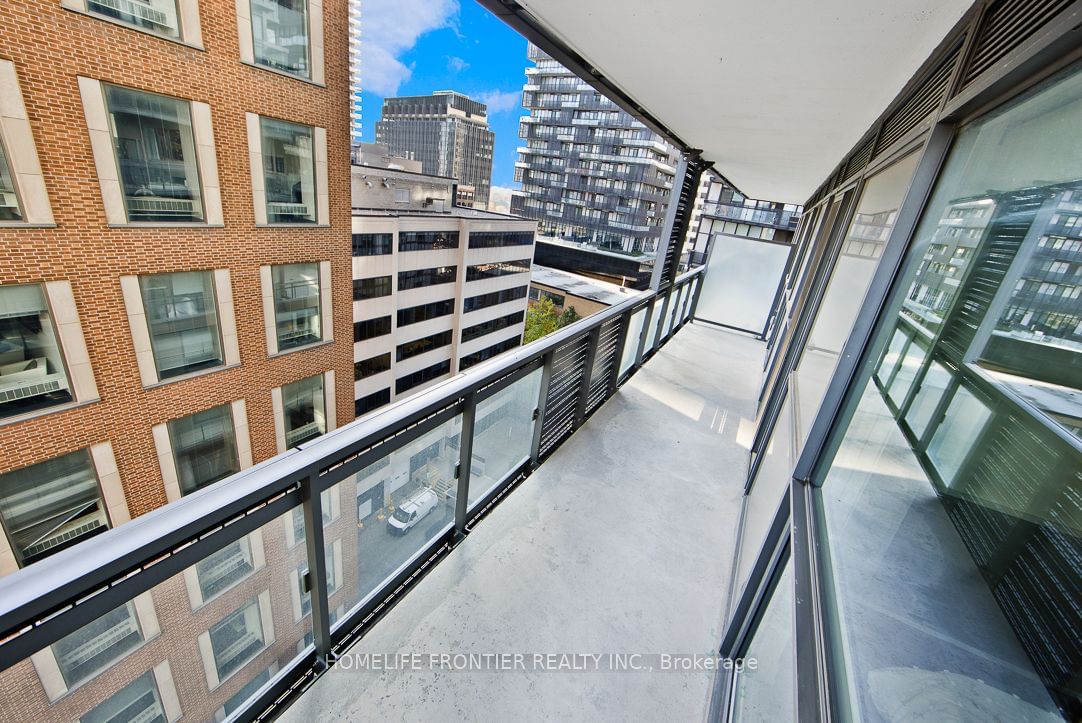
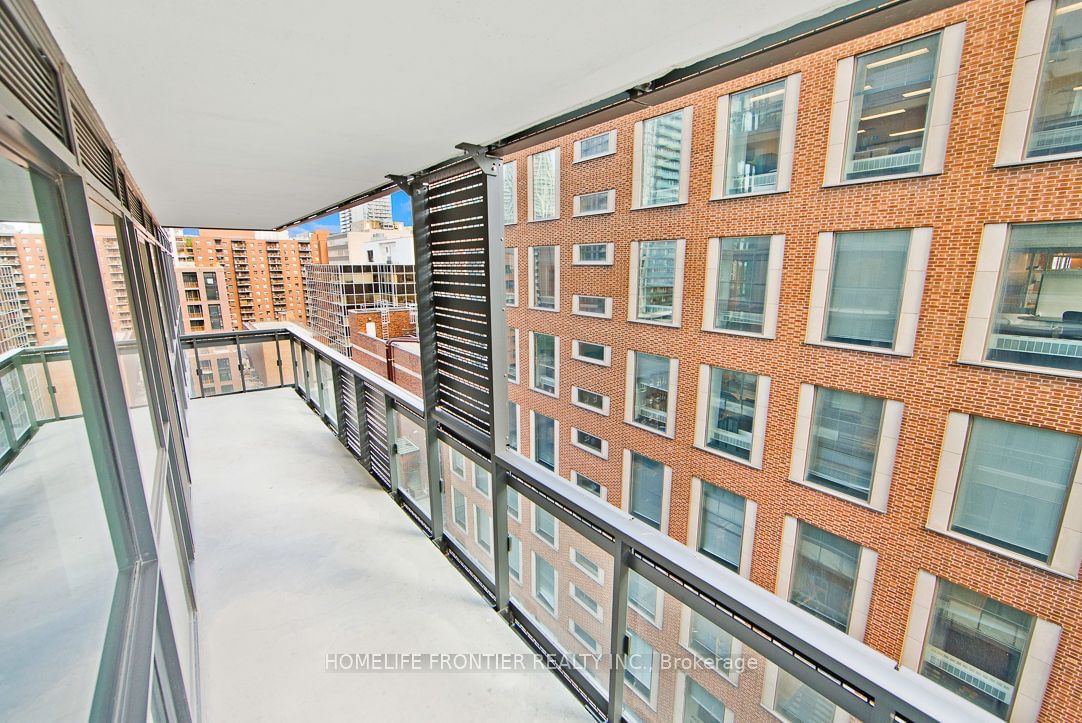
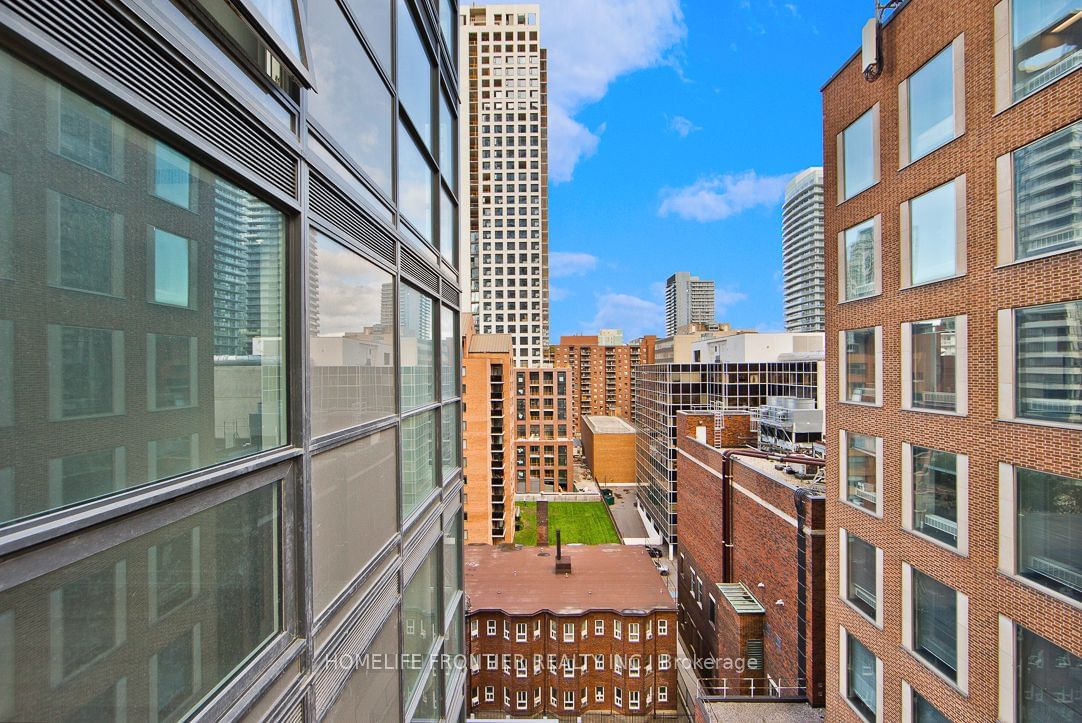
Welcome to urban living at its finest in the heart of Toronto's vibrant Yonge & Eglinton. This stunning 2-bedroom plus den apartment offers a seamless blend of modern luxury and convenience, perfect for those seeking a contemporary lifestyle in a highly coveted location. As you step into this meticulously designed space, you'll immediately notice the attention to detail and the abundance of natural light that fills every room. The open-concept living area is both spacious and inviting, with high ceilings that create an airy and welcoming atmosphere. Situated in the highly sought-after Yonge and Eglinton area, you'll have unparalleled access to an array of trendy cafes, top-notch restaurants, boutique shops, and entertainment options. With excellent public transportation and major thoroughfares nearby, exploring the rest of Toronto.
homelife frontier realty inc.MLS® #C10432620
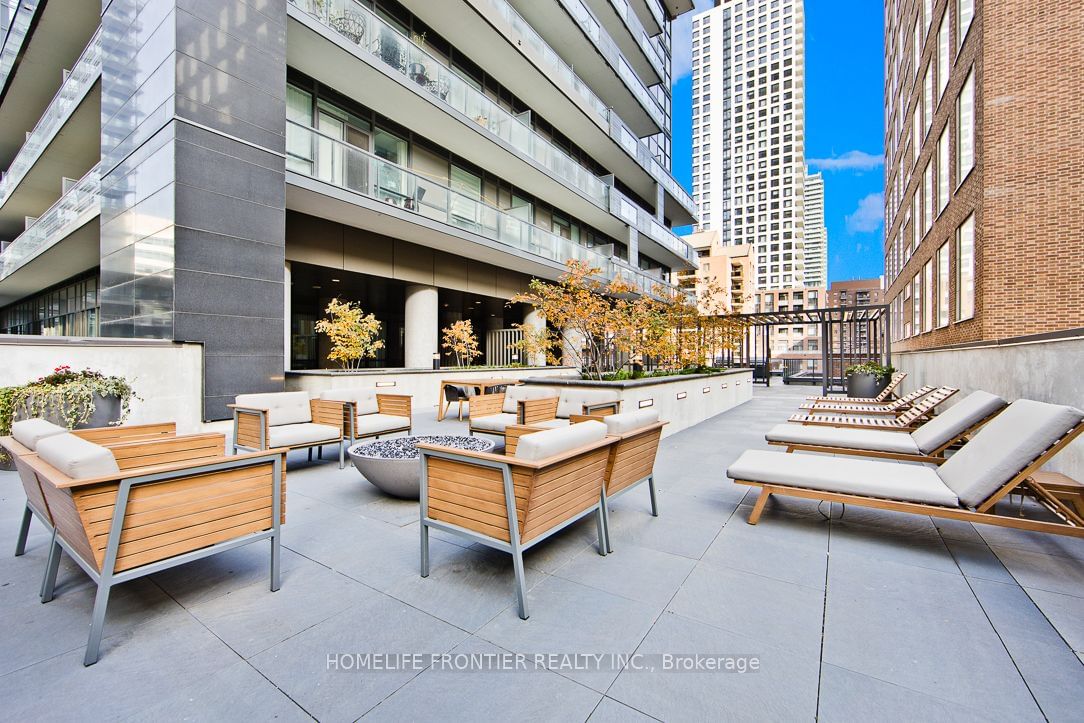
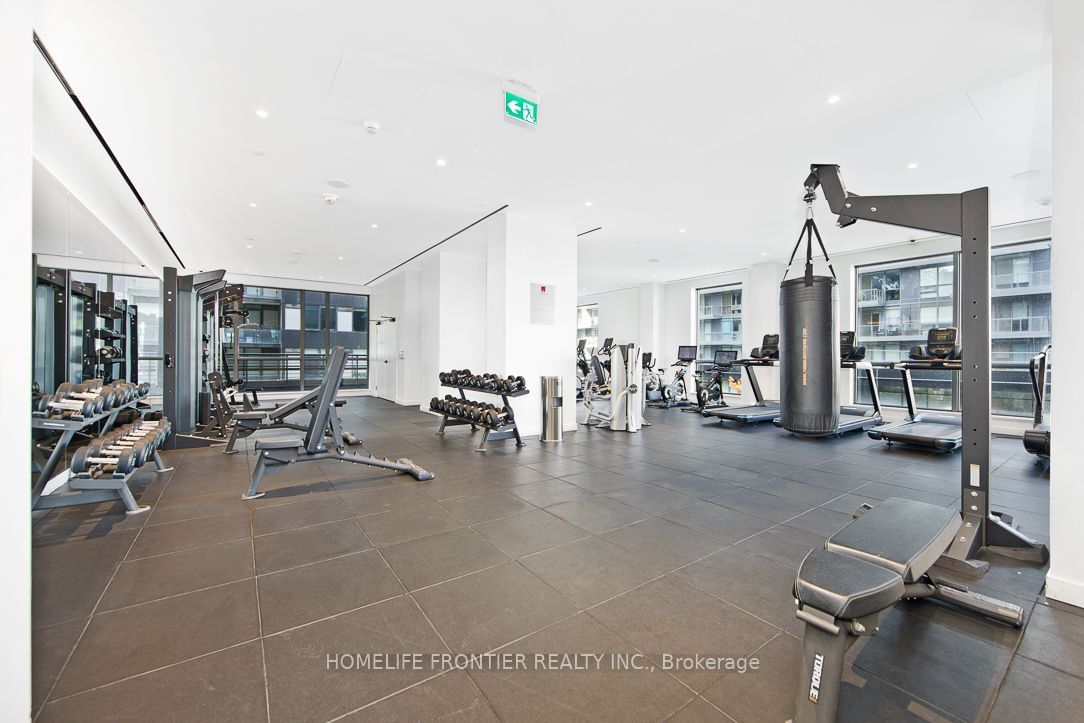
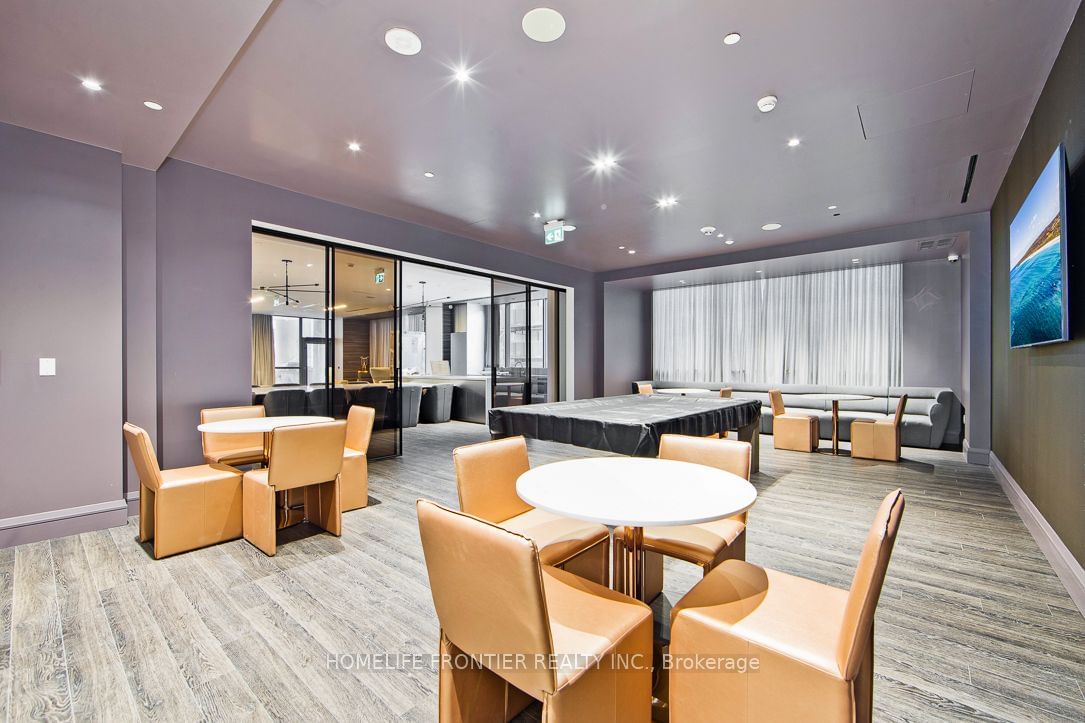
Amenities
Explore Neighbourhood
Similar Listings
Demographics
Based on the dissemination area as defined by Statistics Canada. A dissemination area contains, on average, approximately 200 – 400 households.
Price Trends
Maintenance Fees
Building Trends At E2 Condos
Days on Strata
List vs Selling Price
Offer Competition
Turnover of Units
Property Value
Price Ranking
Sold Units
Rented Units
Best Value Rank
Appreciation Rank
Rental Yield
High Demand
Transaction Insights at 39 Roehampton Avenue
| 1 Bed | 1 Bed + Den | 2 Bed | 2 Bed + Den | 3 Bed | 3 Bed + Den | |
|---|---|---|---|---|---|---|
| Price Range | No Data | $590,000 - $695,000 | $672,000 - $760,000 | $745,000 - $880,000 | $894,000 - $1,880,000 | No Data |
| Avg. Cost Per Sqft | No Data | $1,024 | $1,046 | $977 | $1,114 | No Data |
| Price Range | $2,100 - $2,850 | $2,400 - $3,000 | $2,600 - $3,950 | $1,500 - $3,250 | $3,800 - $4,200 | No Data |
| Avg. Wait for Unit Availability | No Data | 313 Days | 38 Days | 42 Days | 76 Days | 28 Days |
| Avg. Wait for Unit Availability | 169 Days | 8 Days | 4 Days | 27 Days | 23 Days | No Data |
| Ratio of Units in Building | 6% | 27% | 50% | 8% | 11% | 1% |
Transactions vs Inventory
Total number of units listed and leased in Mount Pleasant West
