2904 - 99 Broadway Ave


Listing History
Unit Highlights
Utilities Included
Utility Type
- Air Conditioning
- Central Air
- Heat Source
- Gas
- Heating
- Forced Air
Room Dimensions
About this Listing
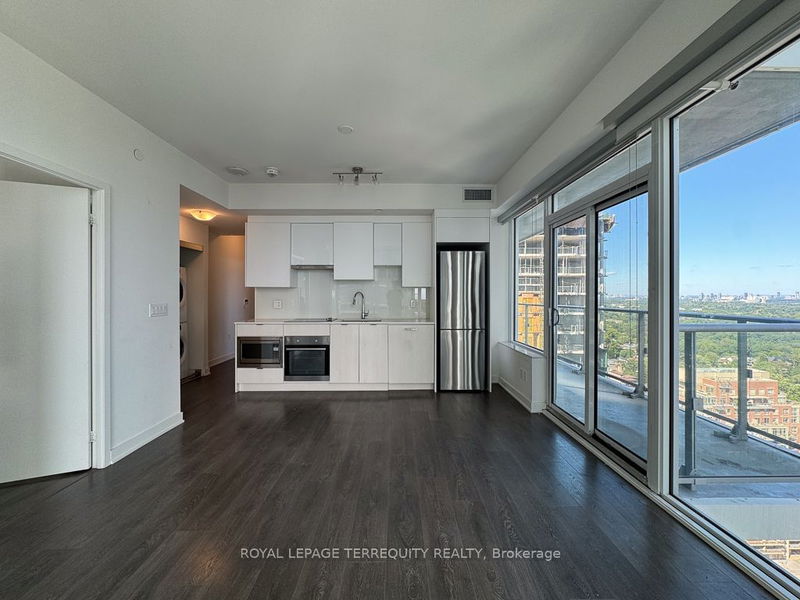
Located in the vibrant Yonge and Eglinton area, this stunning 2-bedroom, 2-bathroom apartment offers a perfect blend of comfort and convenience, ideal for young couples, families, or professionals. Just a 10-minute walk from the subway station, this property positions you in the heart of one of the city's most sought-after neighborhoods, surrounded by a plethora of shops, restaurants, and entertainment options, boasting an excellent walk score. Enjoy spacious living with floor-to-ceiling windows that bathe the interior in natural sunlight, enhancing the home's open and airy feel. For additional convenience, 1 parking space and 1 locker are included.
ExtrasBuilt-in S/S Kitchen Appliances: Fridge, Wall Oven, Microwave, Range Hood, Cooktop, Wash/Dryer.
royal lepage terrequity realtyMLS® #C9357756
Amenities
Explore Neighbourhood
Similar Listings
Demographics
Based on the dissemination area as defined by Statistics Canada. A dissemination area contains, on average, approximately 200 – 400 households.
Price Trends
Maintenance Fees
Building Trends At CityLights on Broadway
Days on Strata
List vs Selling Price
Offer Competition
Turnover of Units
Property Value
Price Ranking
Sold Units
Rented Units
Best Value Rank
Appreciation Rank
Rental Yield
High Demand
Transaction Insights at 99 Broadway Avenue
| Studio | 1 Bed | 1 Bed + Den | 2 Bed | 2 Bed + Den | 3 Bed | 3 Bed + Den | |
|---|---|---|---|---|---|---|---|
| Price Range | $397,000 - $430,000 | $458,000 - $531,000 | $485,000 - $690,000 | $626,800 - $900,000 | $925,000 | No Data | No Data |
| Avg. Cost Per Sqft | $1,148 | $1,149 | $1,092 | $1,041 | $691 | No Data | No Data |
| Price Range | $1,900 - $2,200 | $2,050 - $2,500 | $2,100 - $2,700 | $2,150 - $3,500 | $3,250 - $4,000 | No Data | No Data |
| Avg. Wait for Unit Availability | 124 Days | 46 Days | 45 Days | 51 Days | 518 Days | No Data | No Data |
| Avg. Wait for Unit Availability | 14 Days | 4 Days | 4 Days | 5 Days | 120 Days | No Data | No Data |
| Ratio of Units in Building | 10% | 29% | 31% | 29% | 2% | 1% | 1% |
Transactions vs Inventory
Total number of units listed and leased in Mount Pleasant East
