195 Redpath Ave


1 / 33
MLS Restricted Listing
Free account required. or to see all the details.
Free account required. or to see all the details.
Listing History
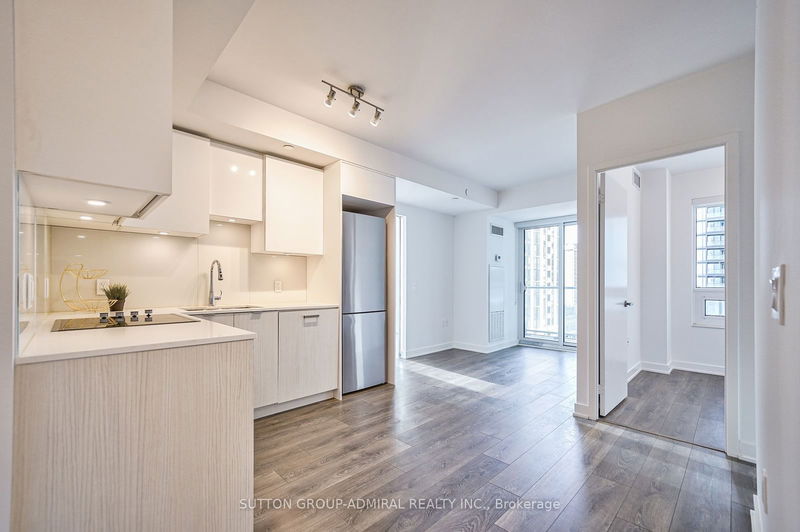
Unit Highlights
MLS Restricted Listing
Free account required. or to see all the details.
Free account required. or to see all the details.
Buyer's Market
Balanced
Seller's Market
Maintenance Fees
Included
Heat
Air Conditioning
Water
Building Maintenance
Building Insurance
Excluded
Hydro
Utility Type
- Air Conditioning
- Central Air
- Heat Source
- Gas
- Heating
- Forced Air
Amenities
Rooftop Deck
Outdoor Pool
Gym Room
Concierge
Indoor Pool
Guest Suites
Explore Neighbourhood
9/10
Walkability
One small step for you. One giant leap towards never needing a gym membership.
8/10
Transit
So frequent, you might accidentally start collecting tickets.
5/10
Bikeability
You'll have a love-hate relationship with your gears. Mostly hate.
Similar Listings
Demographics
Based on the dissemination area as defined by Statistics Canada. A dissemination area contains, on average, approximately 200 – 400 households.
Population
15,396
Average Individual Income
$62,966
Average Household Size
3 persons
Average Age
45
Average Household Income
$112,148
Dominant Housing Type
Detached
Population By Age
Household Income
Housing Types & Tenancy
Detached
52%
Semi Detached
21%
Low Rise Apartment
11%
High Rise Apartment
8%
Duplex
6%
Marital Status
Commute
Languages (Primary Language)
English
53%
Cantonese
16%
Mandarin
15%
Other
11%
Tamil
3%
Tagalog
1%
Spanish
1%
Education
University and Above
32%
High School
26%
None
17%
College
16%
Apprenticeship
3%
University Below Batchelor
3%
Major Field of Study
Business Management
25%
Architecture & Engineering
18%
Health & Related Fields
12%
Social Sciences
11%
Math & Computer Sciences
7%
Humanities
5%
Physical Sciences
5%
Education
4%
Visual & Performing Arts
3%
Personal, Protective & Transportation Services
2%
Agriculture & Natural Resources
1%
Price Trends
Maintenance Fees
CityLights on Broadway vs The Mount Pleasant East Area
Building Trends At CityLights on Broadway
Days on Strata
Units at CityLights on Broadway spend an average of
31
Days on Strata
based on recent sales
List vs Selling Price
On average, these condos sell for
1%
below
the list price.
Offer Competition
Condos in this building have an
AVERAGEchance of receiving
Multiple Offers
compared to other buildings in Mount Pleasant East
Turnover of Units
On average, each unit is owned for
N/A
Property Value
-5%
Decrease in property value within the past twelve months
Price Ranking
5th
Highest price per SQFT out of 50 condos in the Mount Pleasant East area
Sold Units
46
Units were Sold over the past twelve months
Rented Units
240
Units were Rented over the past twelve months
Best Value Rank
CityLights on Broadway offers the best value out of 50 condos in the Mount Pleasant East neighbourhood
?
Appreciation Rank
CityLights on Broadway has the highest ROI out of 50 condos in the Mount Pleasant East neighbourhood
?
Rental Yield
CityLights on Broadway yields the highest rent prices out of 50 condos in the Mount Pleasant East neighbourhood
?
High Demand
CityLights on Broadway is the most popular building out of 50 condos in the Mount Pleasant East neighbourhood
?
Transaction Insights at 99 Broadway Avenue
| Studio | 1 Bed | 1 Bed + Den | 2 Bed | 2 Bed + Den | 3 Bed | 3 Bed + Den | |
|---|---|---|---|---|---|---|---|
| Price Range | $397,000 - $430,000 | $458,000 - $531,000 | $485,000 - $690,000 | $626,800 - $900,000 | $925,000 | No Data | No Data |
| Avg. Cost Per Sqft | $1,148 | $1,149 | $1,092 | $1,041 | $691 | No Data | No Data |
| Price Range | $1,900 - $2,200 | $2,050 - $2,500 | $2,100 - $2,700 | $2,150 - $3,500 | $3,250 - $4,000 | No Data | No Data |
| Avg. Wait for Unit Availability | 124 Days | 46 Days | 45 Days | 51 Days | 518 Days | No Data | No Data |
| Avg. Wait for Unit Availability | 14 Days | 4 Days | 4 Days | 5 Days | 120 Days | No Data | No Data |
| Ratio of Units in Building | 10% | 29% | 31% | 29% | 2% | 1% | 1% |
Transactions vs Inventory
Total number of units listed and sold in Mount Pleasant East
