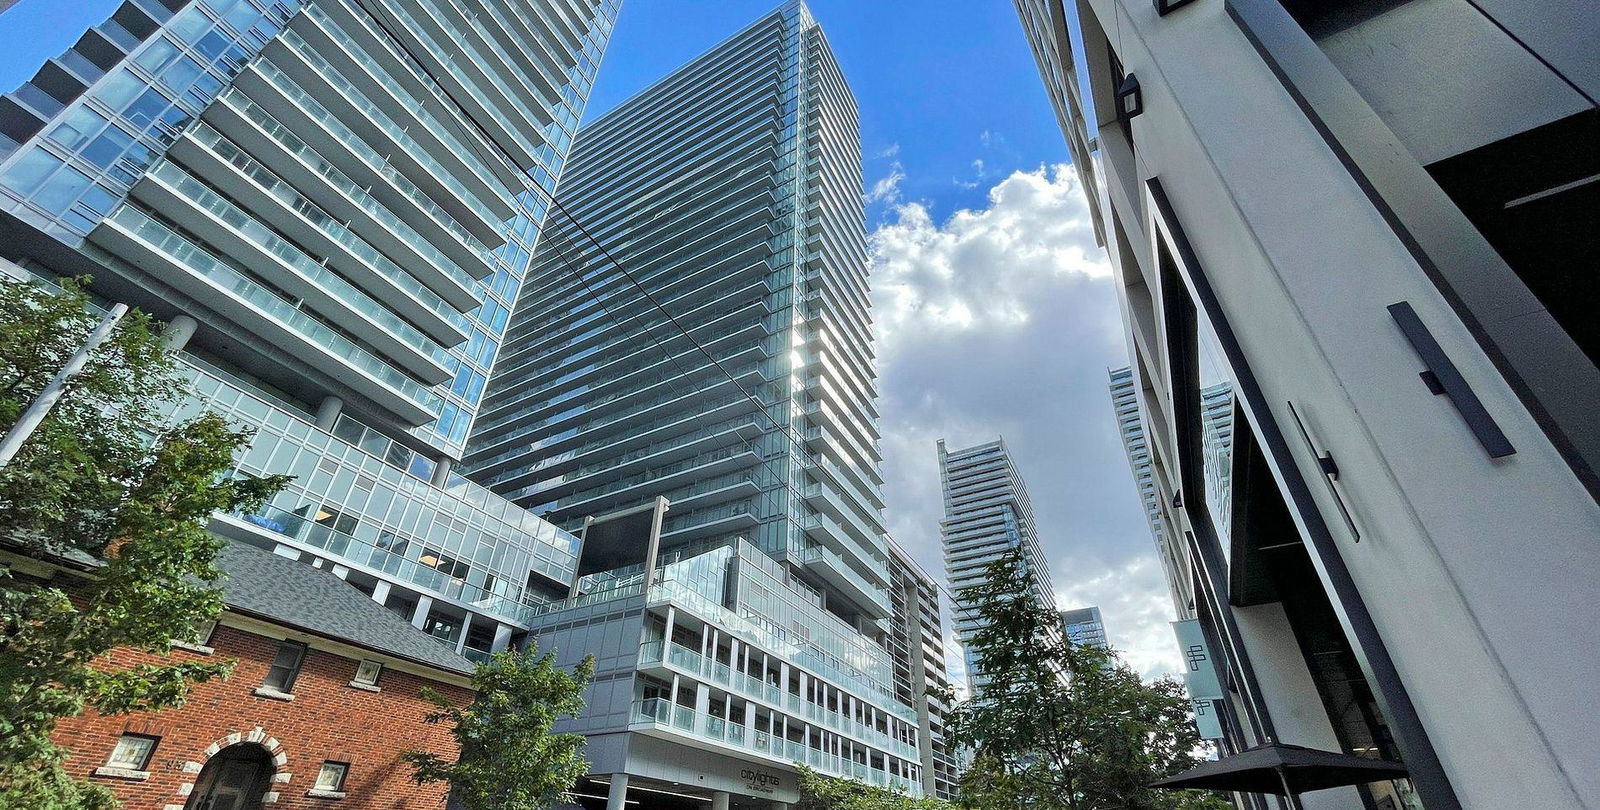
2202 - 195 Redpath Ave
Listing History
Unit Highlights
Property Type:
Condo
Maintenance Fees:
$357/mth
Taxes:
$1,845 (2024)
Cost Per Sqft:
$1,148/sqft
Outdoor Space:
Balcony
Locker:
Owned
Exposure:
North
Possession Date:
To Be Arranged
Amenities
About this Listing
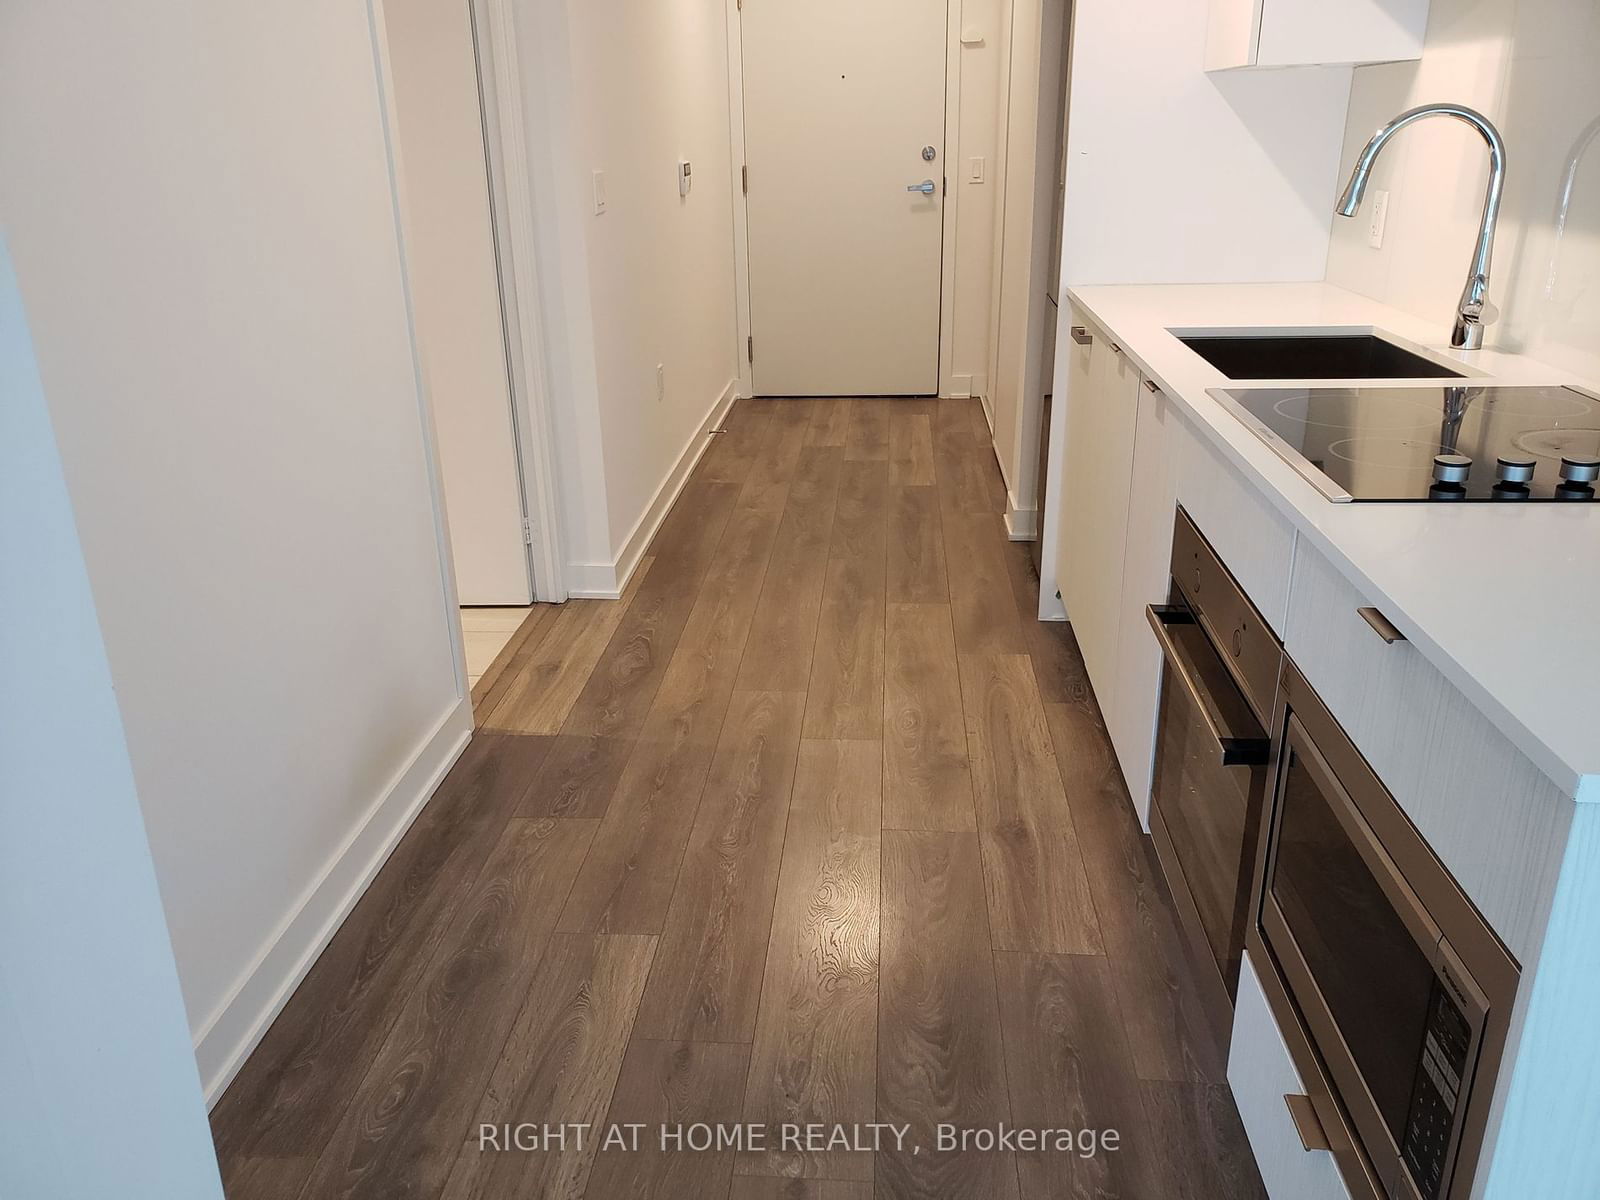
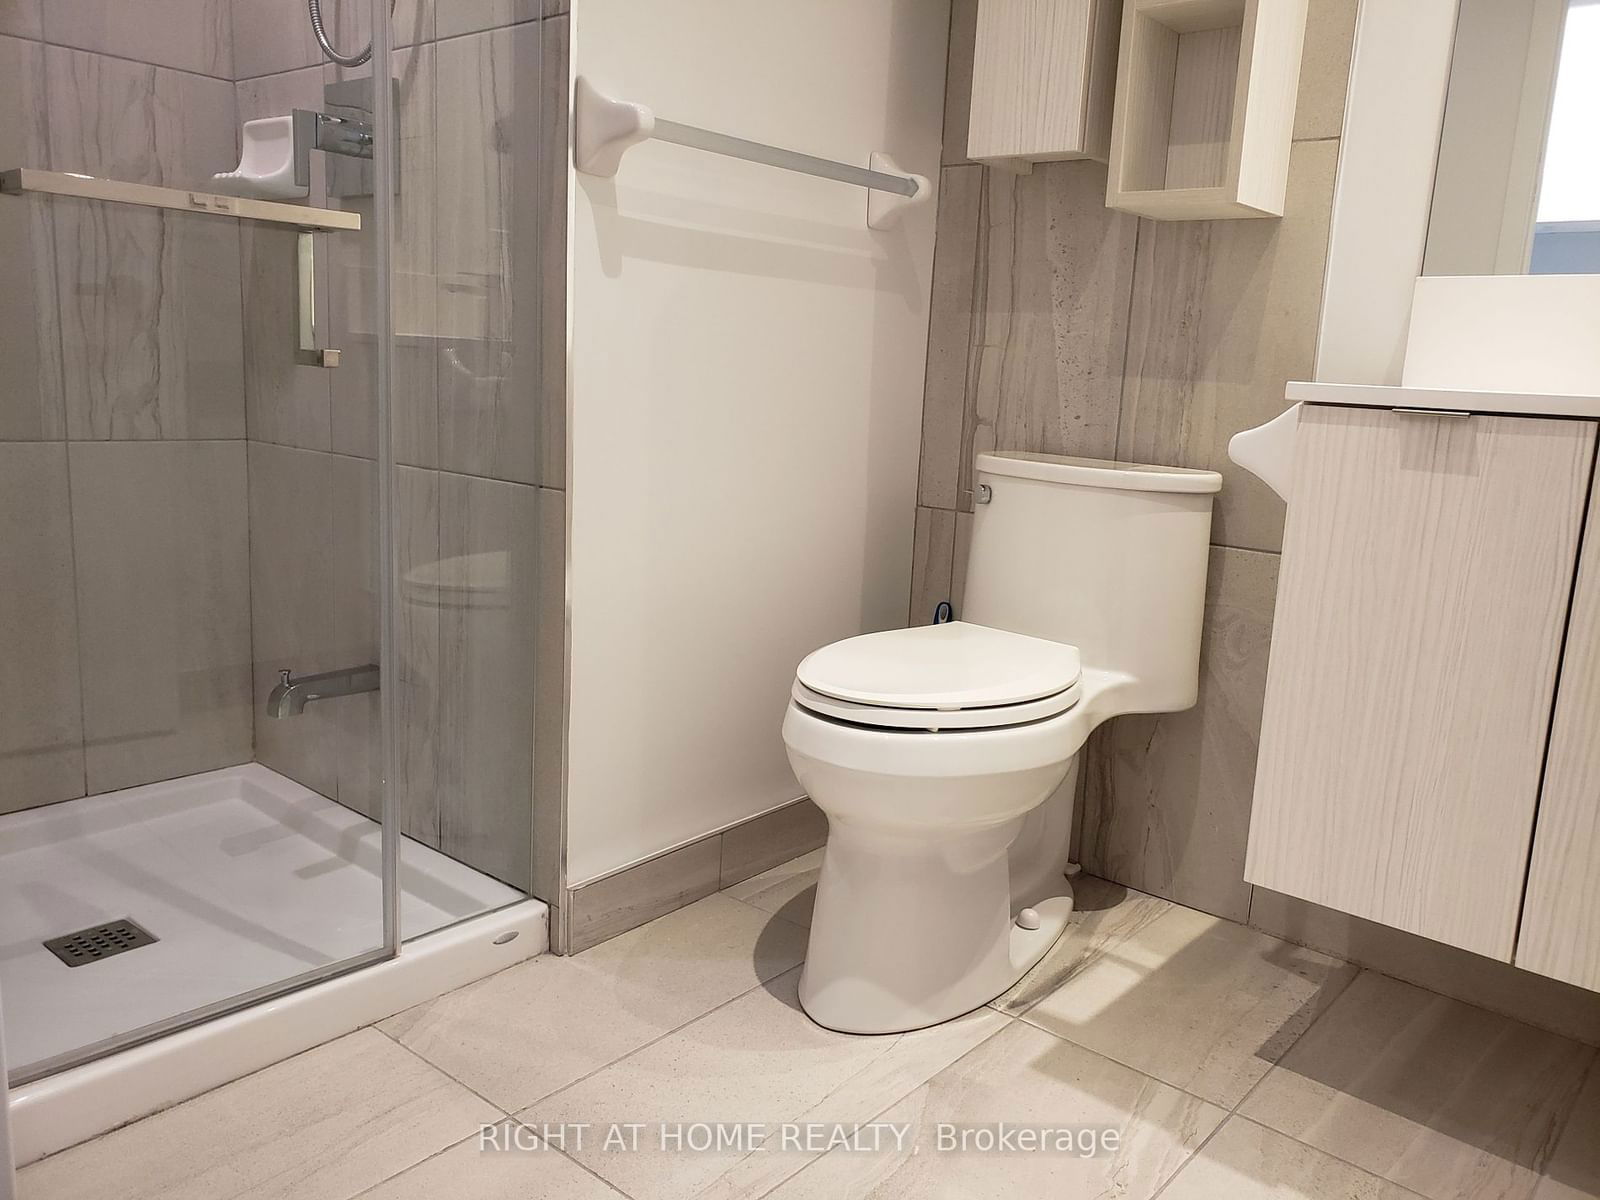
Location1 Location! Yonge & Eglinton Citylights 1 Bed Condo. This Unit Has Bright & Functional Layout W/Huge Balcony(93ft2). Walk Score 93/100 Area. Y & E is Lined With Great Restaurants, Entertainment, Retail Shops. Enjoy the Convenient, Luxurious & Fun Lifestyle for All Walk of Life. Condos Offers Over 18,000sf of Indoor and Over 10,000 sf of Outdoor Designer Selected Amenities. The New Addition of the LRT Sets this Area One day Becomes the CENTRE of the City of Toronto.
ExtrasS/S Fridge, Oven, Cooktop, Built - in Microwave, Dishwasher, Washer/ Dryer, All Elfs, Window Covering, One Locker.
right at home realtyMLS® #C9507683
Fees & Utilities
Maintenance Fees
Utility Type
Air Conditioning
Heat Source
Heating
Room dimensions are not available for this listing.

Building Spotlight
Similar Listings
Explore Mount Pleasant West
Commute Calculator

Demographics
Based on the dissemination area as defined by Statistics Canada. A dissemination area contains, on average, approximately 200 – 400 households.
Building Trends At CityLights on Broadway
Days on Strata
List vs Selling Price
Or in other words, the
Offer Competition
Turnover of Units
Property Value
Price Ranking
Sold Units
Rented Units
Best Value Rank
Appreciation Rank
Rental Yield
High Demand
Market Insights
Transaction Insights at CityLights on Broadway
| Studio | 1 Bed | 1 Bed + Den | 2 Bed | 2 Bed + Den | 3 Bed | 3 Bed + Den | |
|---|---|---|---|---|---|---|---|
| Price Range | $397,000 - $425,000 | $442,500 - $500,000 | $485,000 - $666,000 | $626,800 - $738,000 | No Data | No Data | No Data |
| Avg. Cost Per Sqft | $1,178 | $1,077 | $1,029 | $974 | No Data | No Data | No Data |
| Price Range | $1,650 - $2,050 | $1,800 - $2,500 | $1,900 - $2,950 | $1,400 - $3,500 | $3,250 - $4,000 | No Data | No Data |
| Avg. Wait for Unit Availability | 131 Days | 40 Days | 39 Days | 51 Days | 518 Days | No Data | No Data |
| Avg. Wait for Unit Availability | 15 Days | 4 Days | 5 Days | 5 Days | 120 Days | No Data | No Data |
| Ratio of Units in Building | 10% | 30% | 31% | 28% | 2% | 1% | 1% |
Market Inventory
Total number of units listed and sold in Mount Pleasant West


