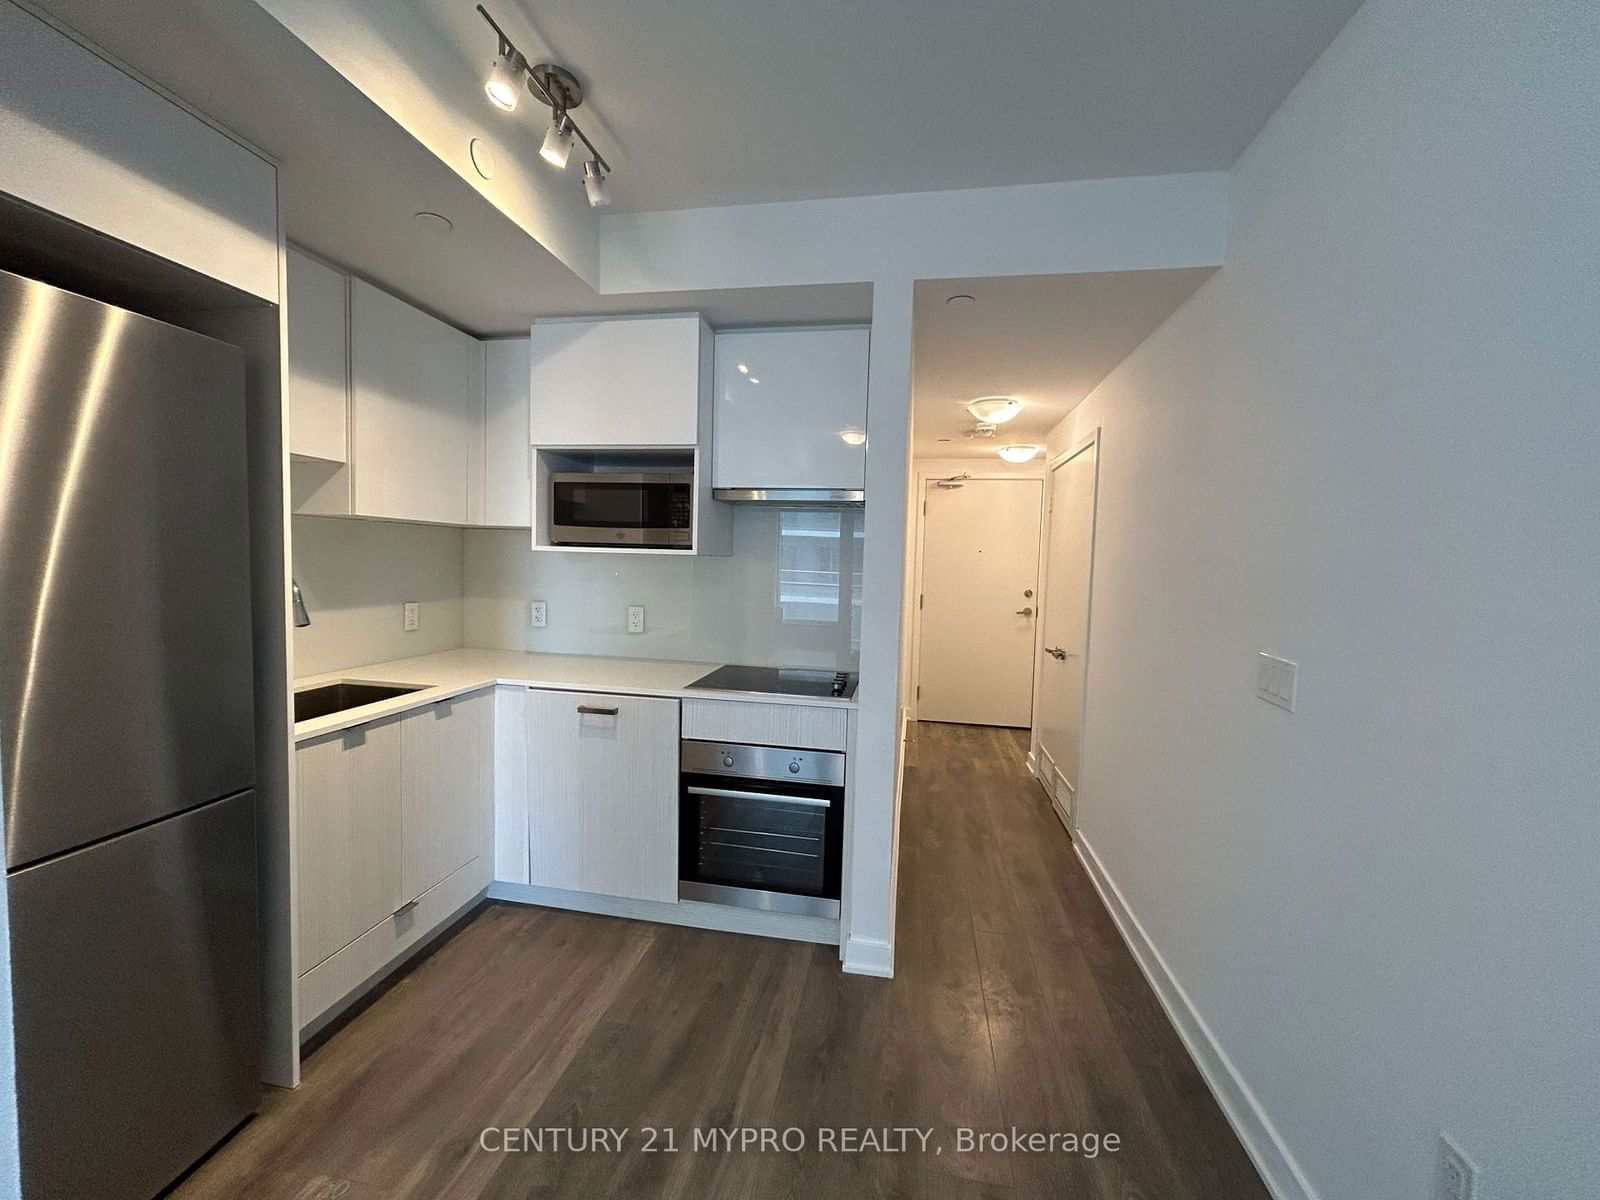
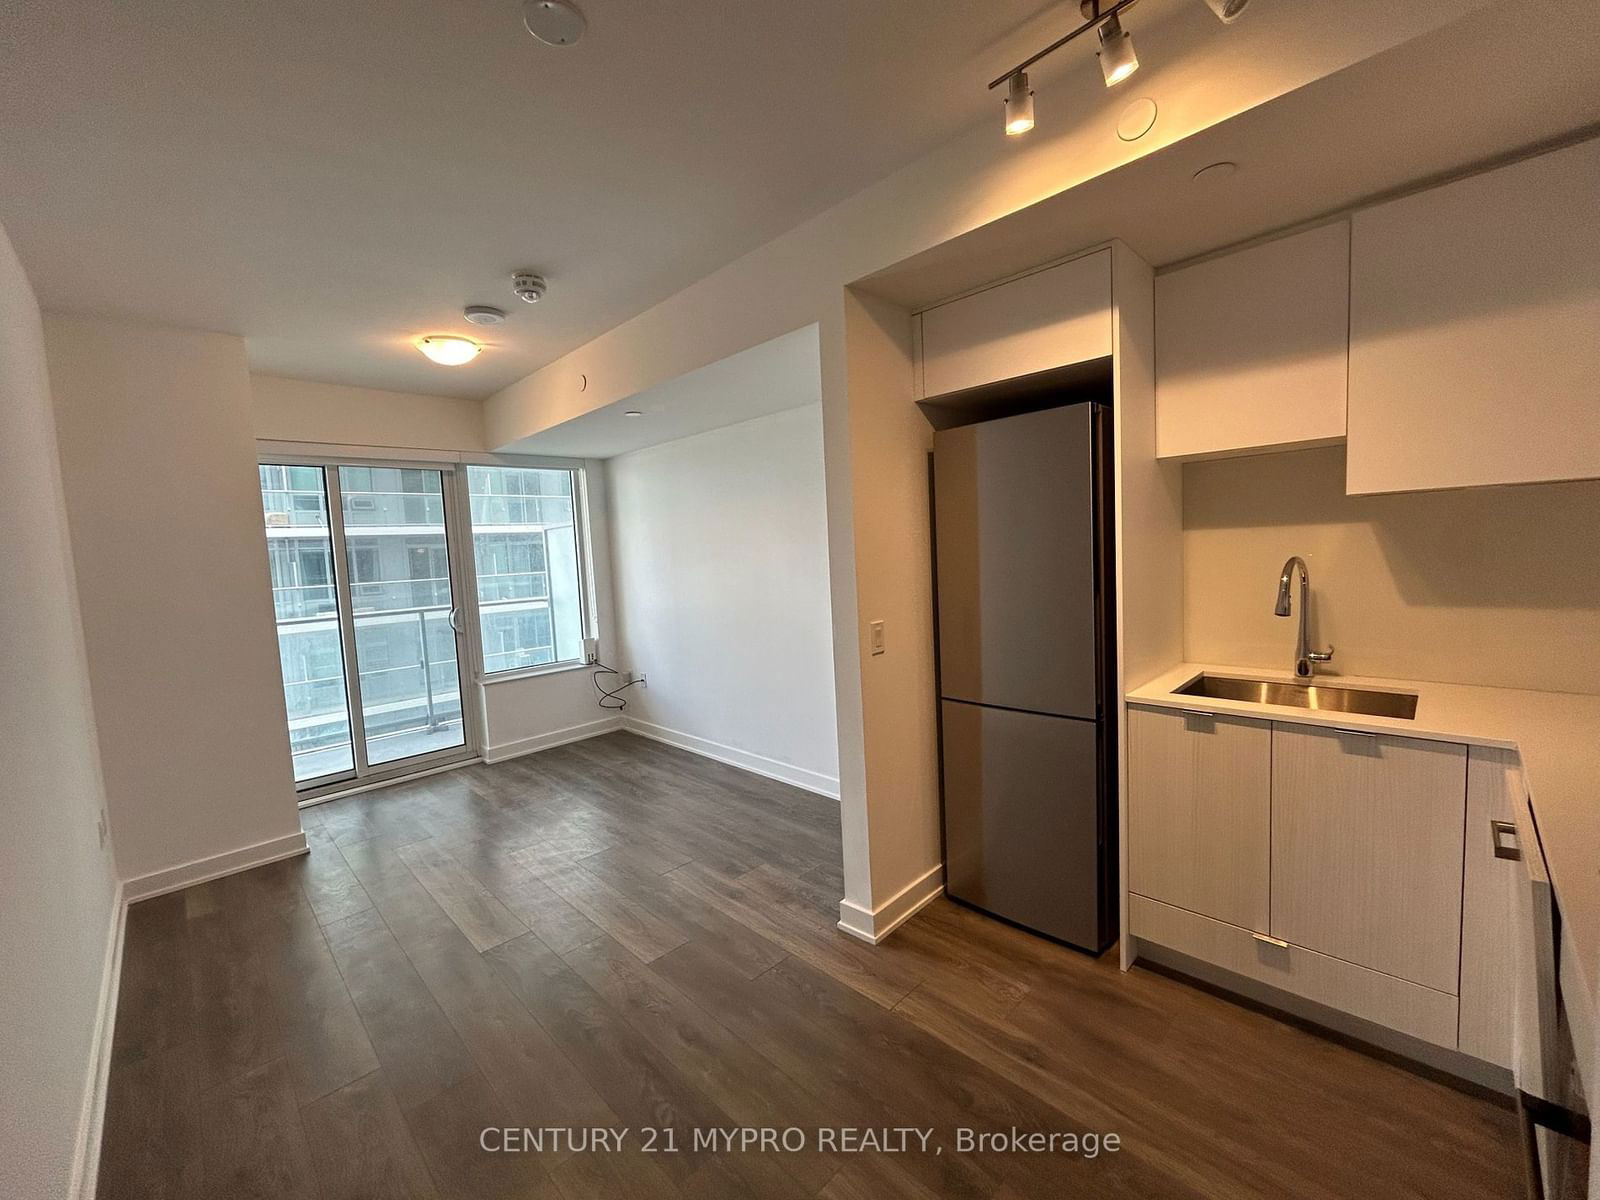
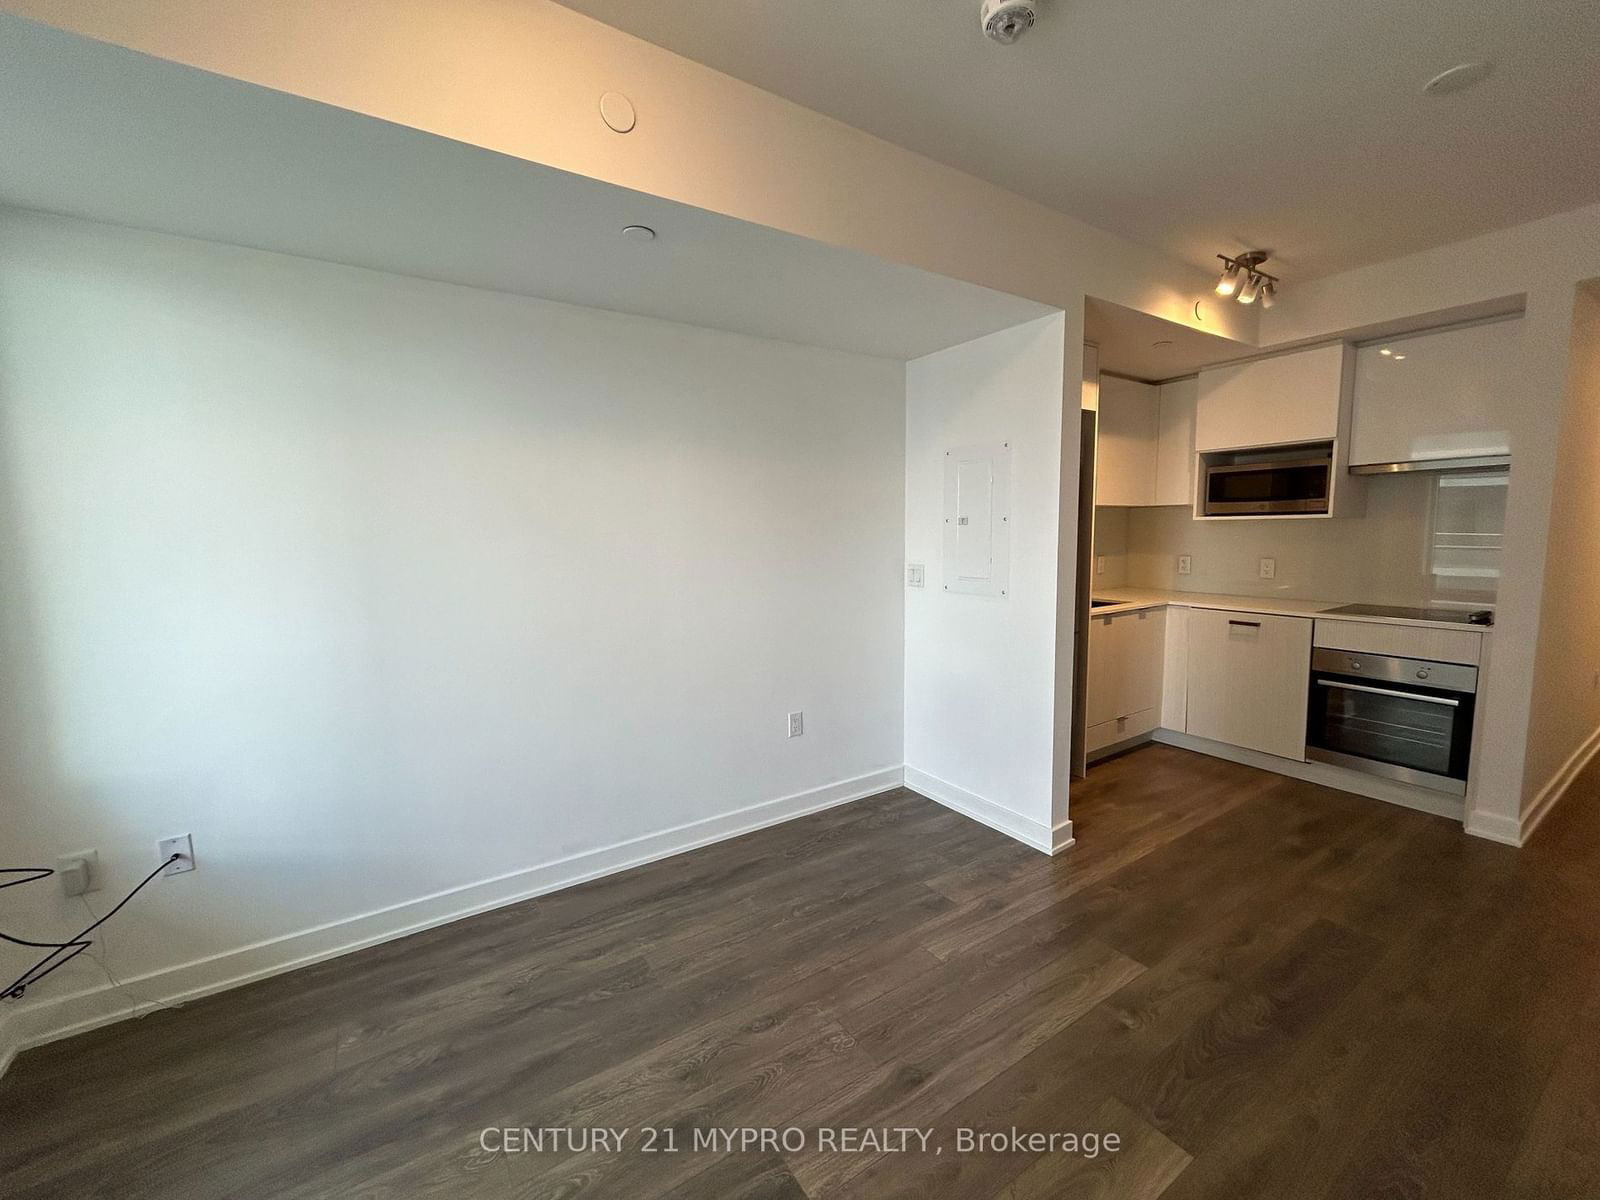
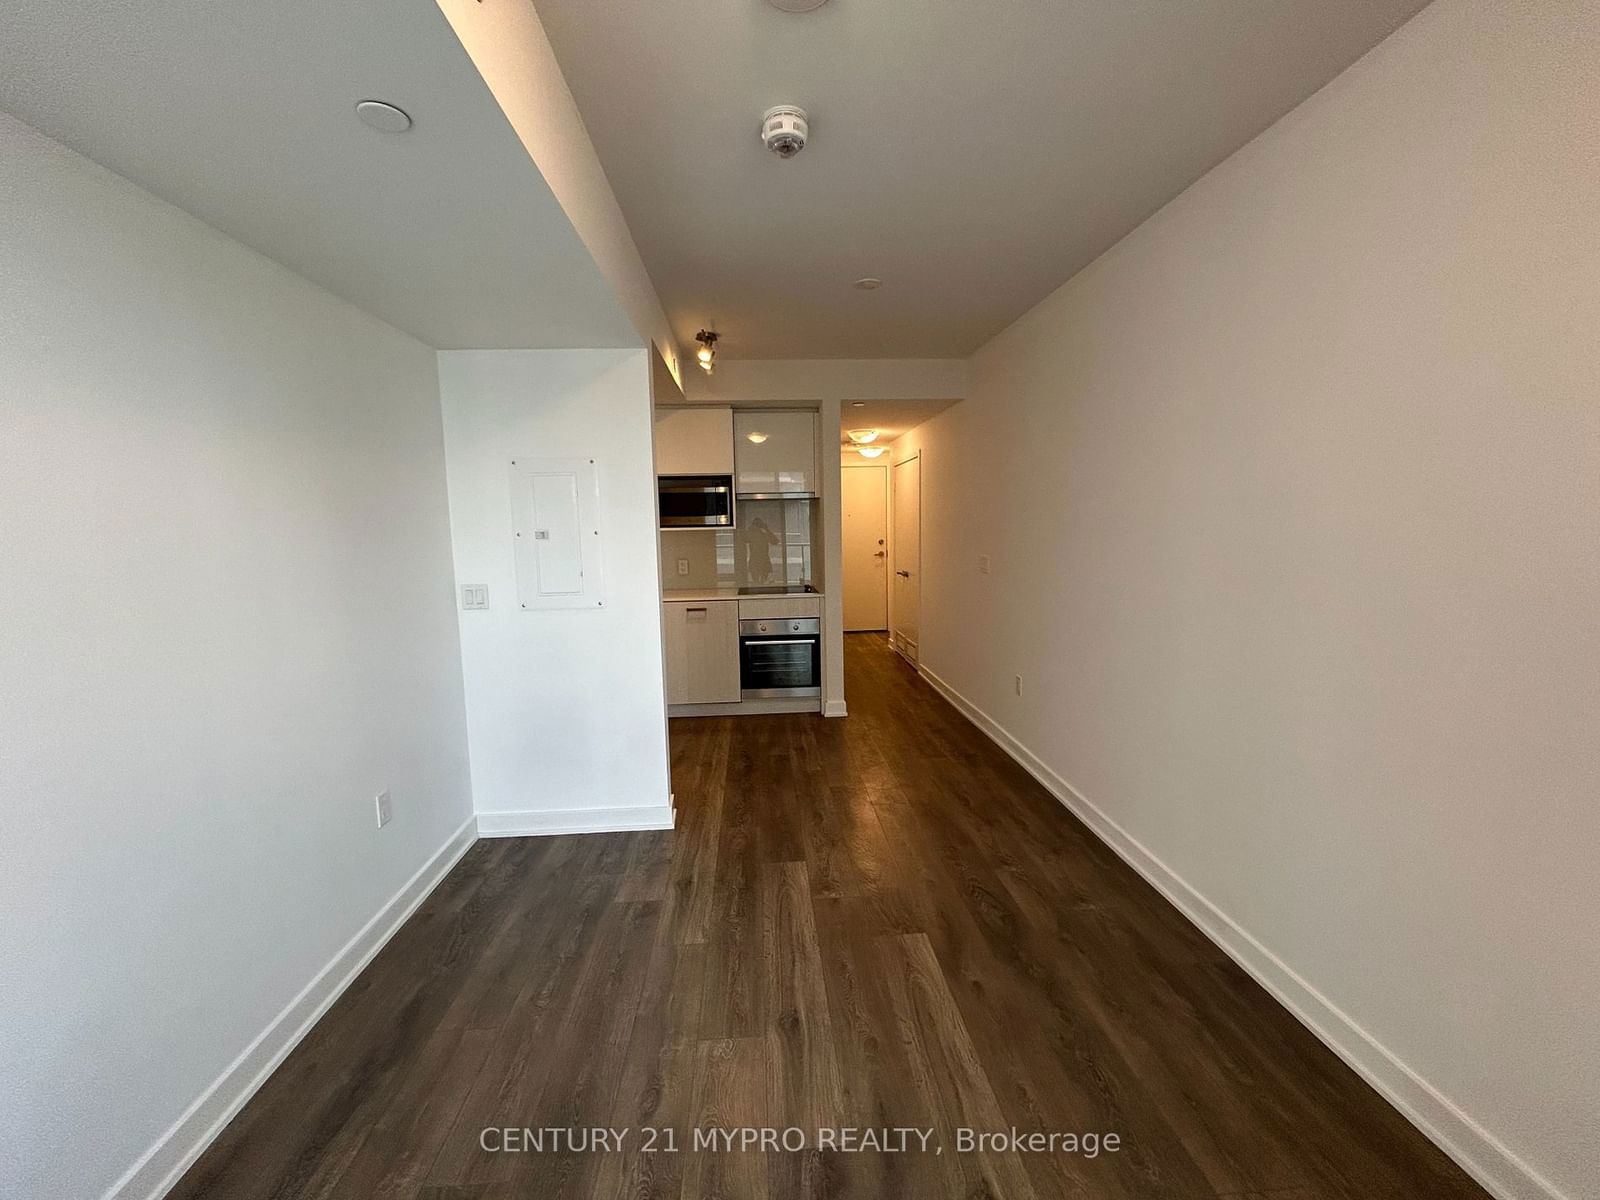
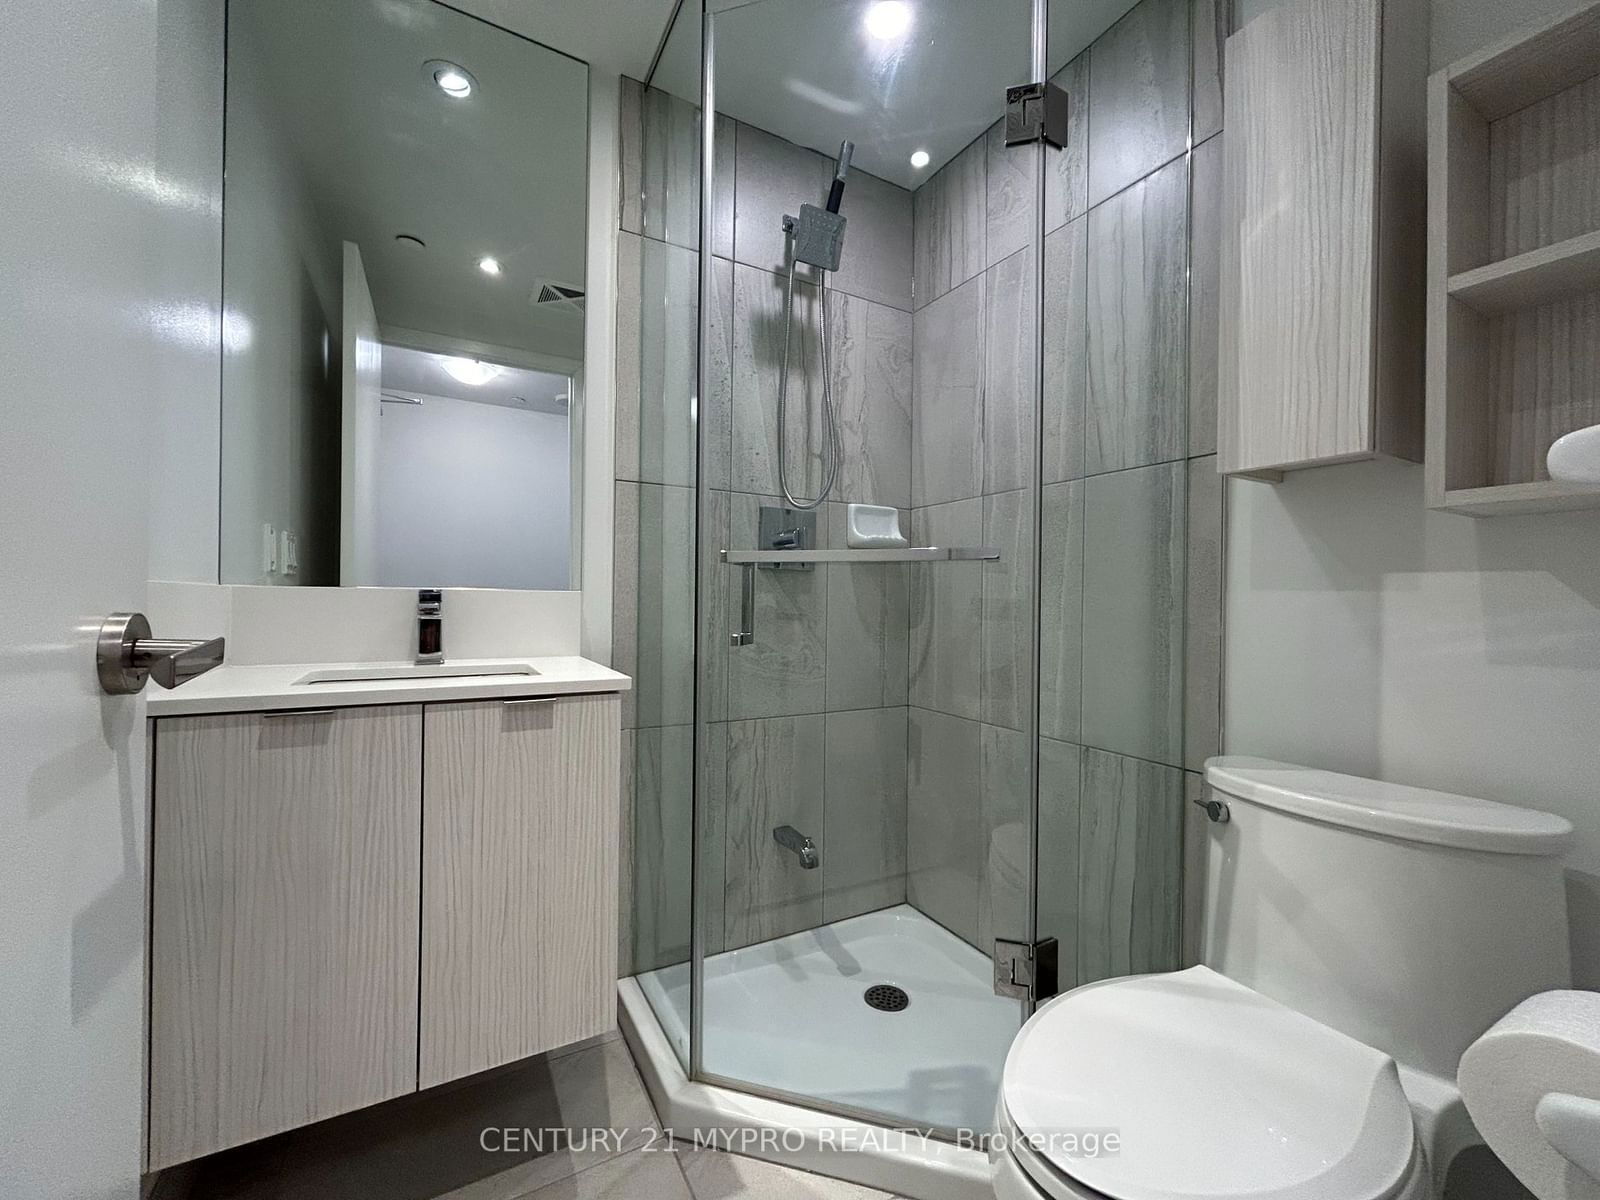
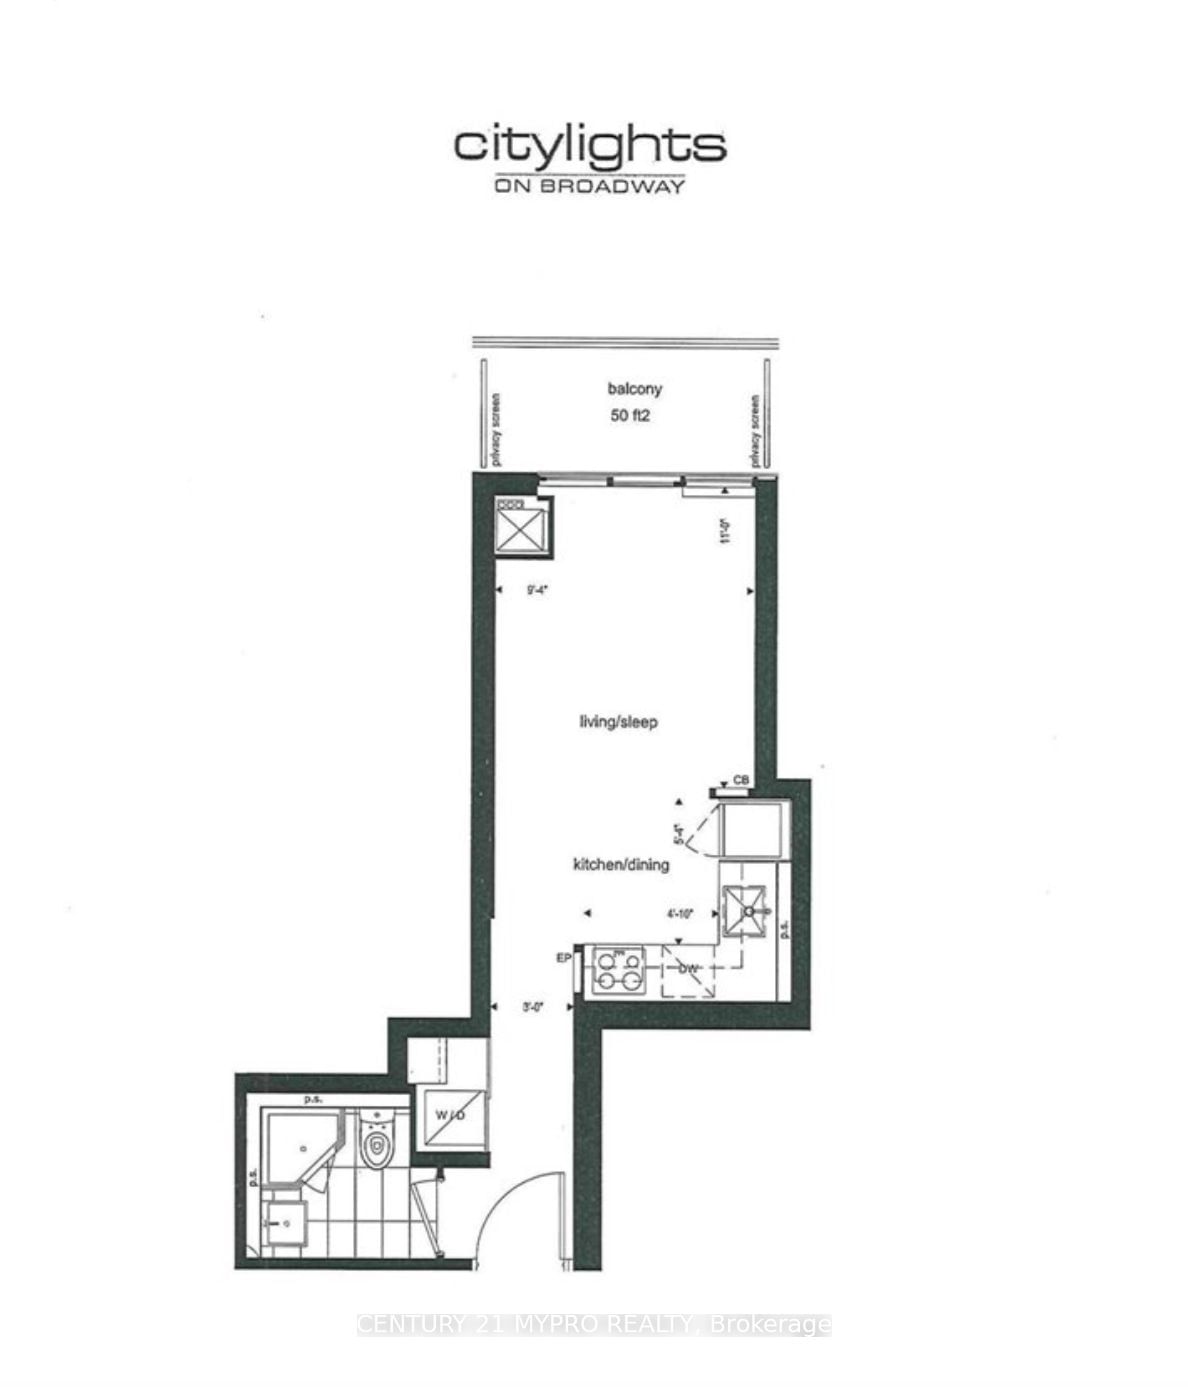
2714 - 195 Redpath Ave
Listing History
Unit Highlights
Property Type:
Condo
Possession Date:
March 1, 2025
Lease Term:
1 Year
Utilities Included:
No
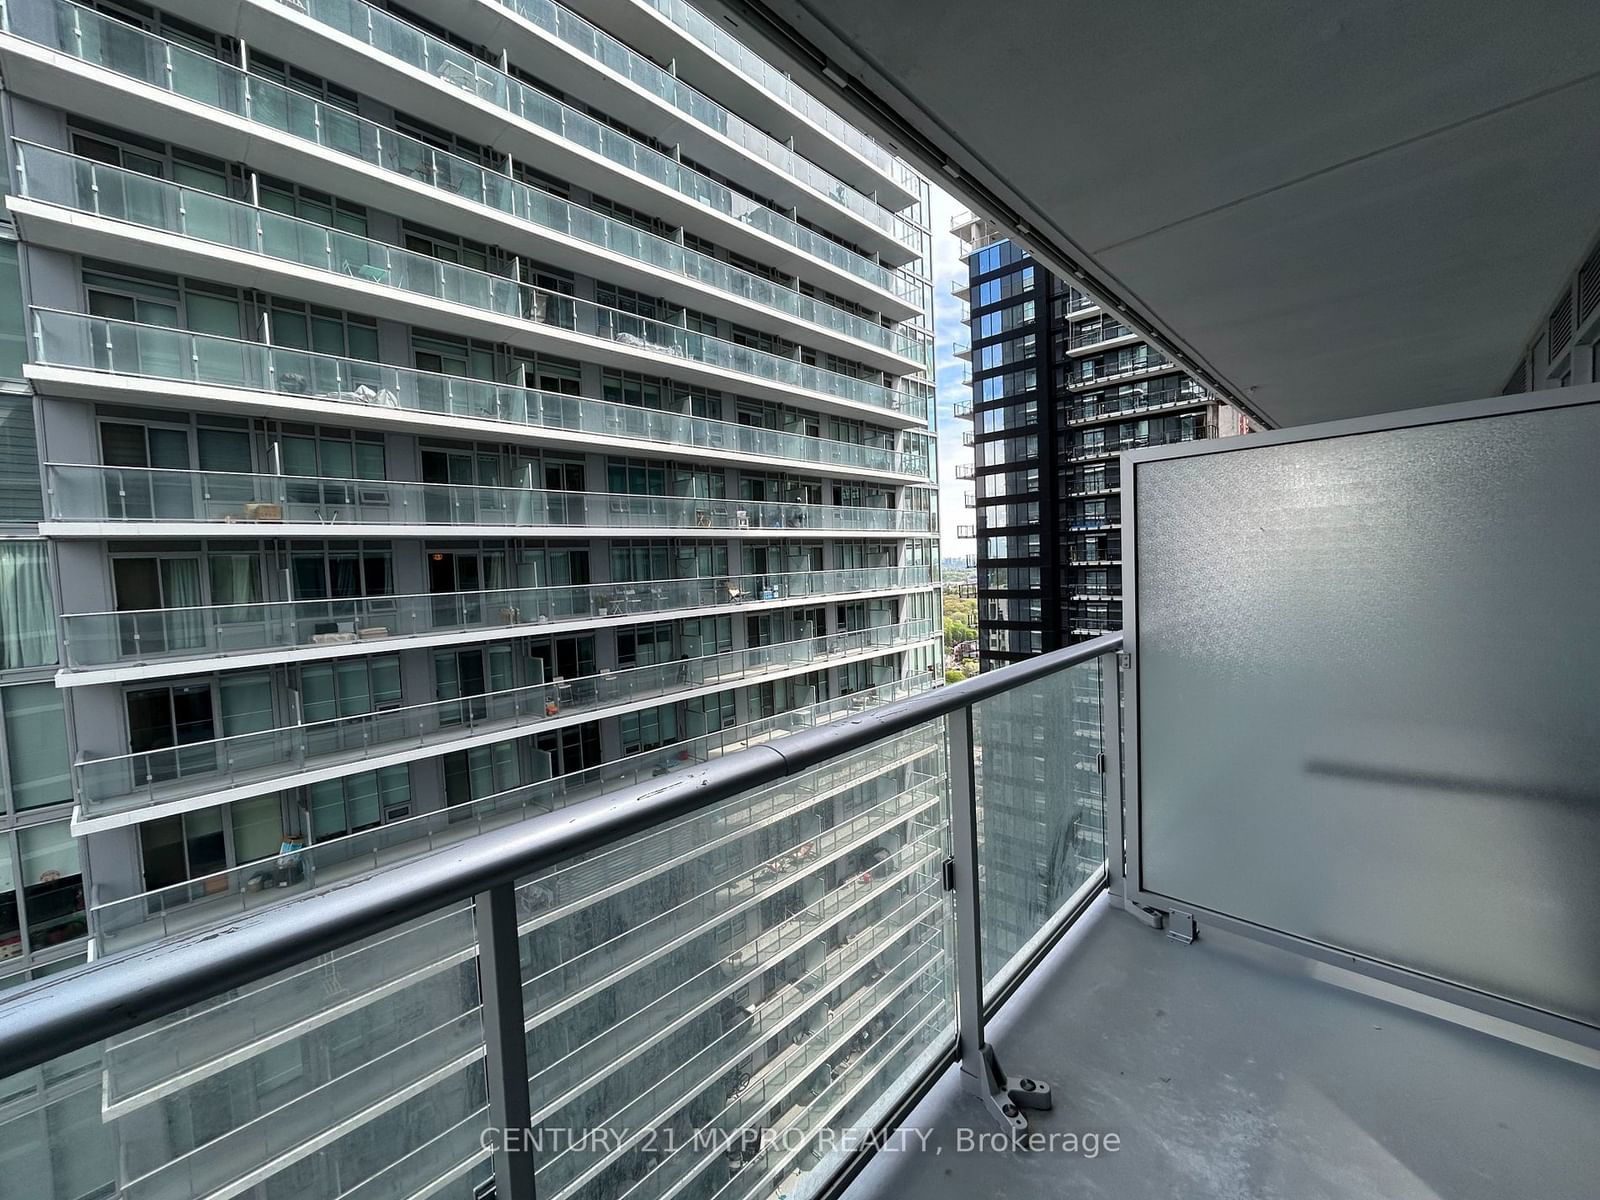
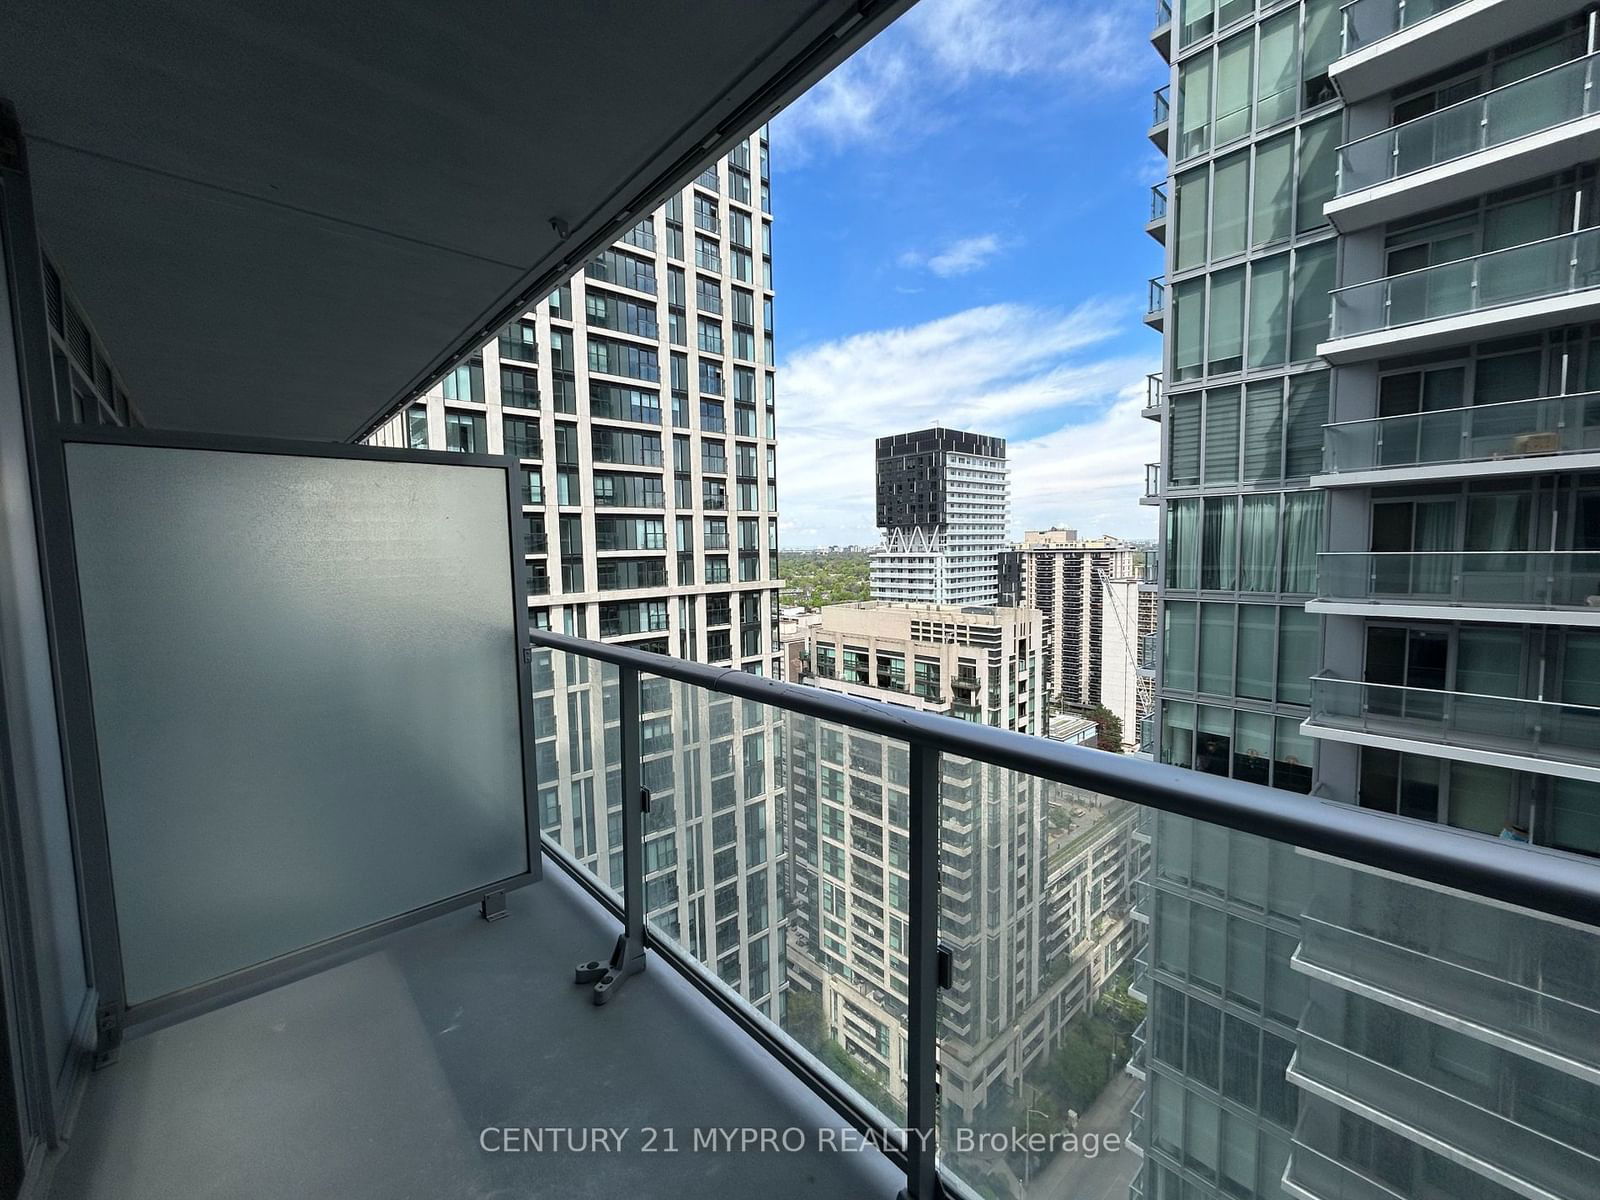
Outdoor Space:
Balcony
Furnished:
No
Exposure:
North
Locker:
Owned
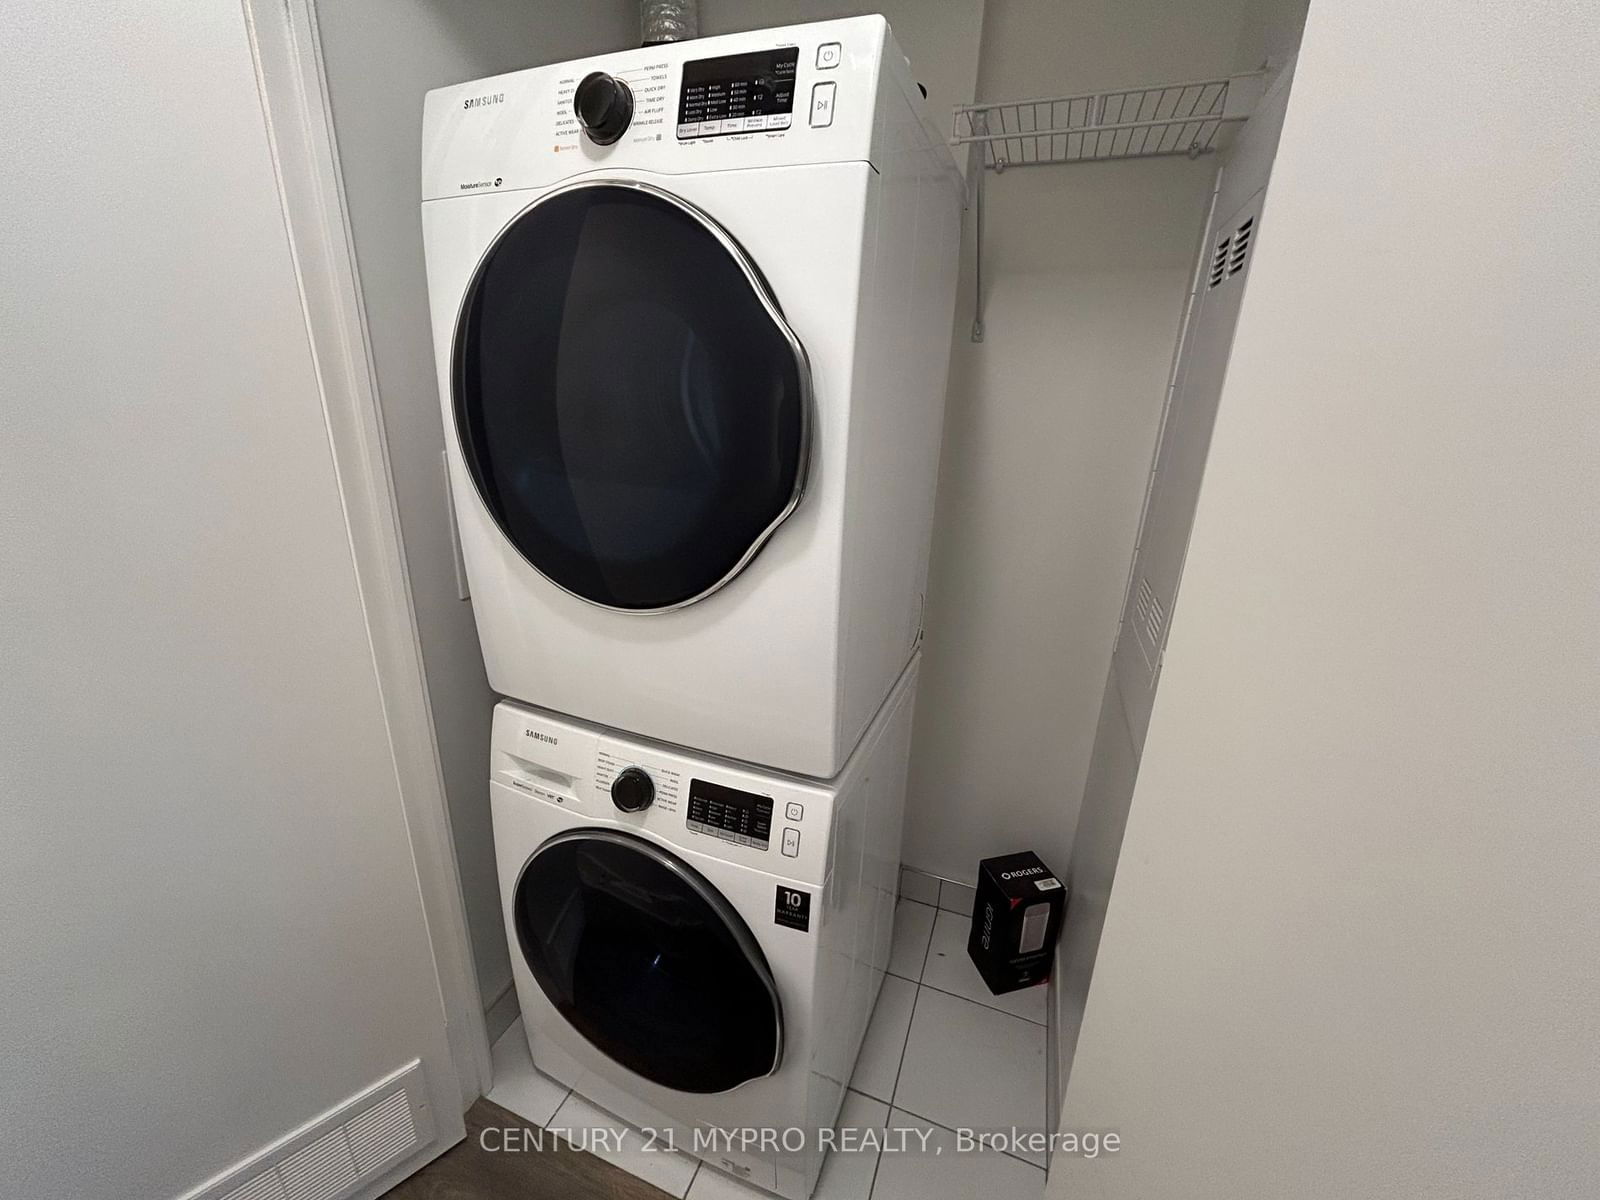
Laundry:
Ensuite
Amenities
About this Listing
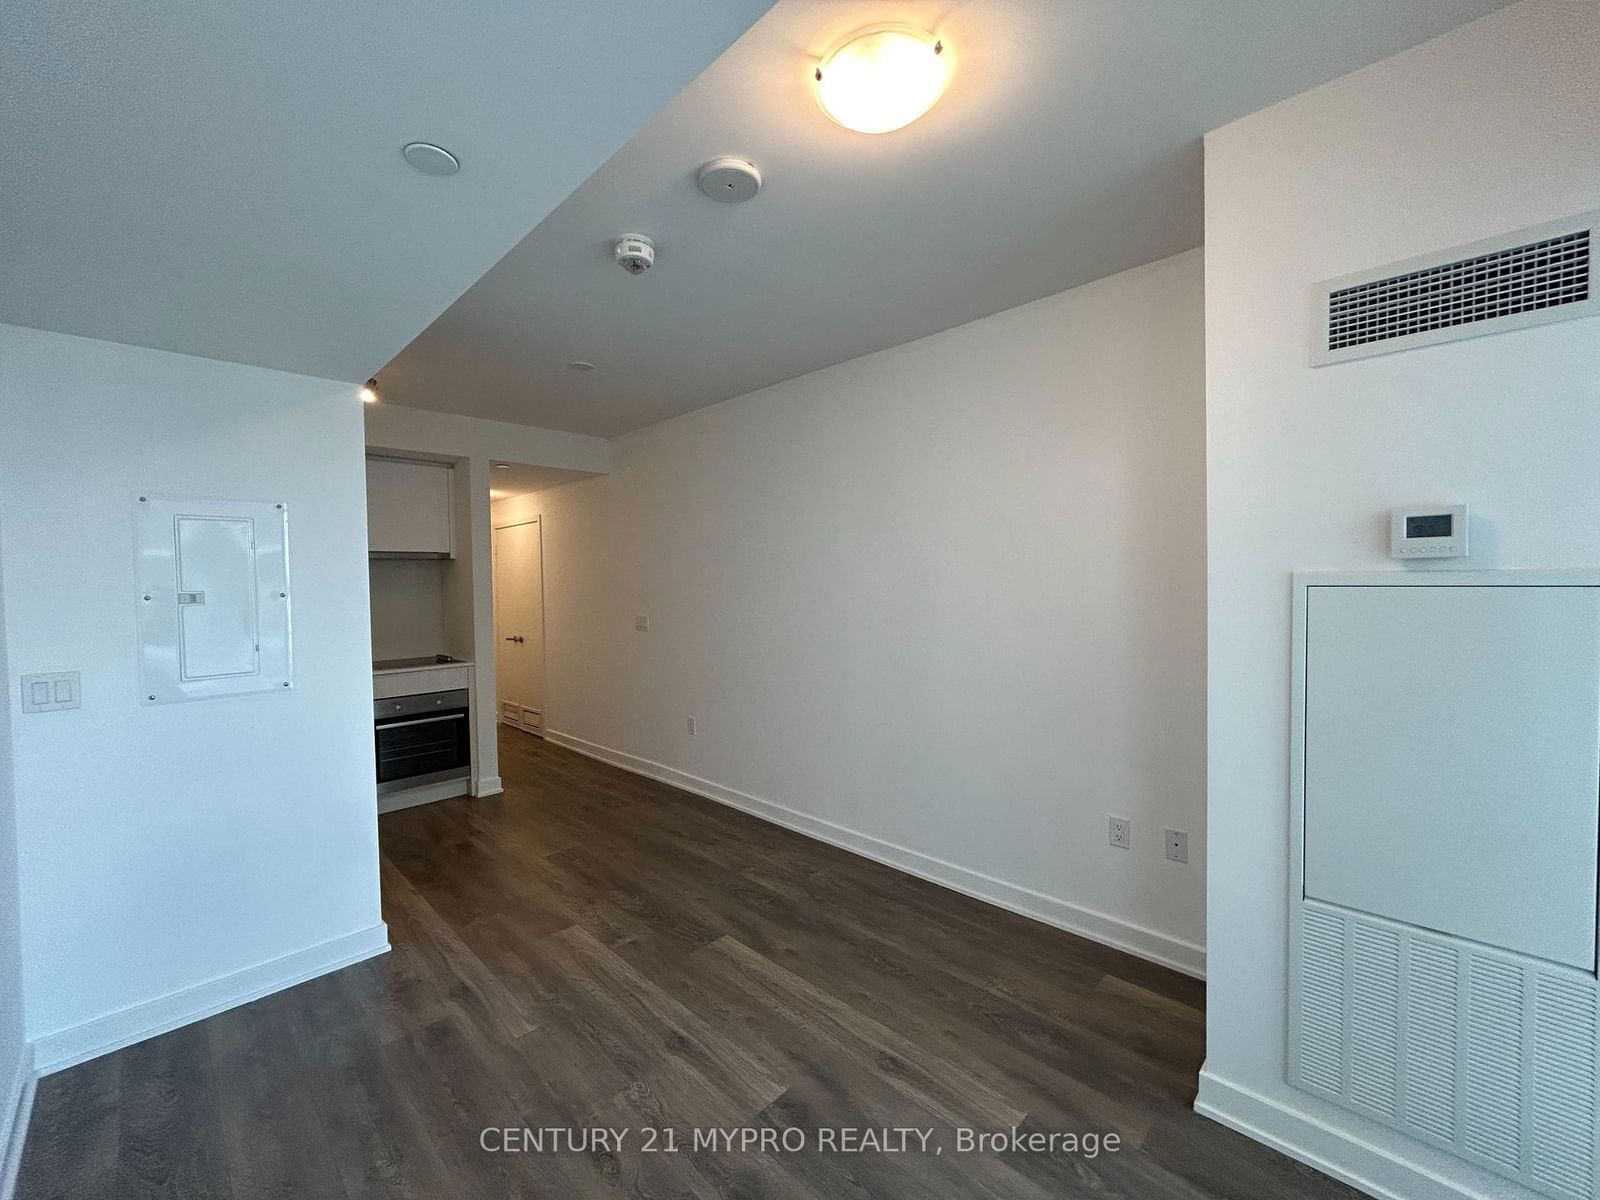
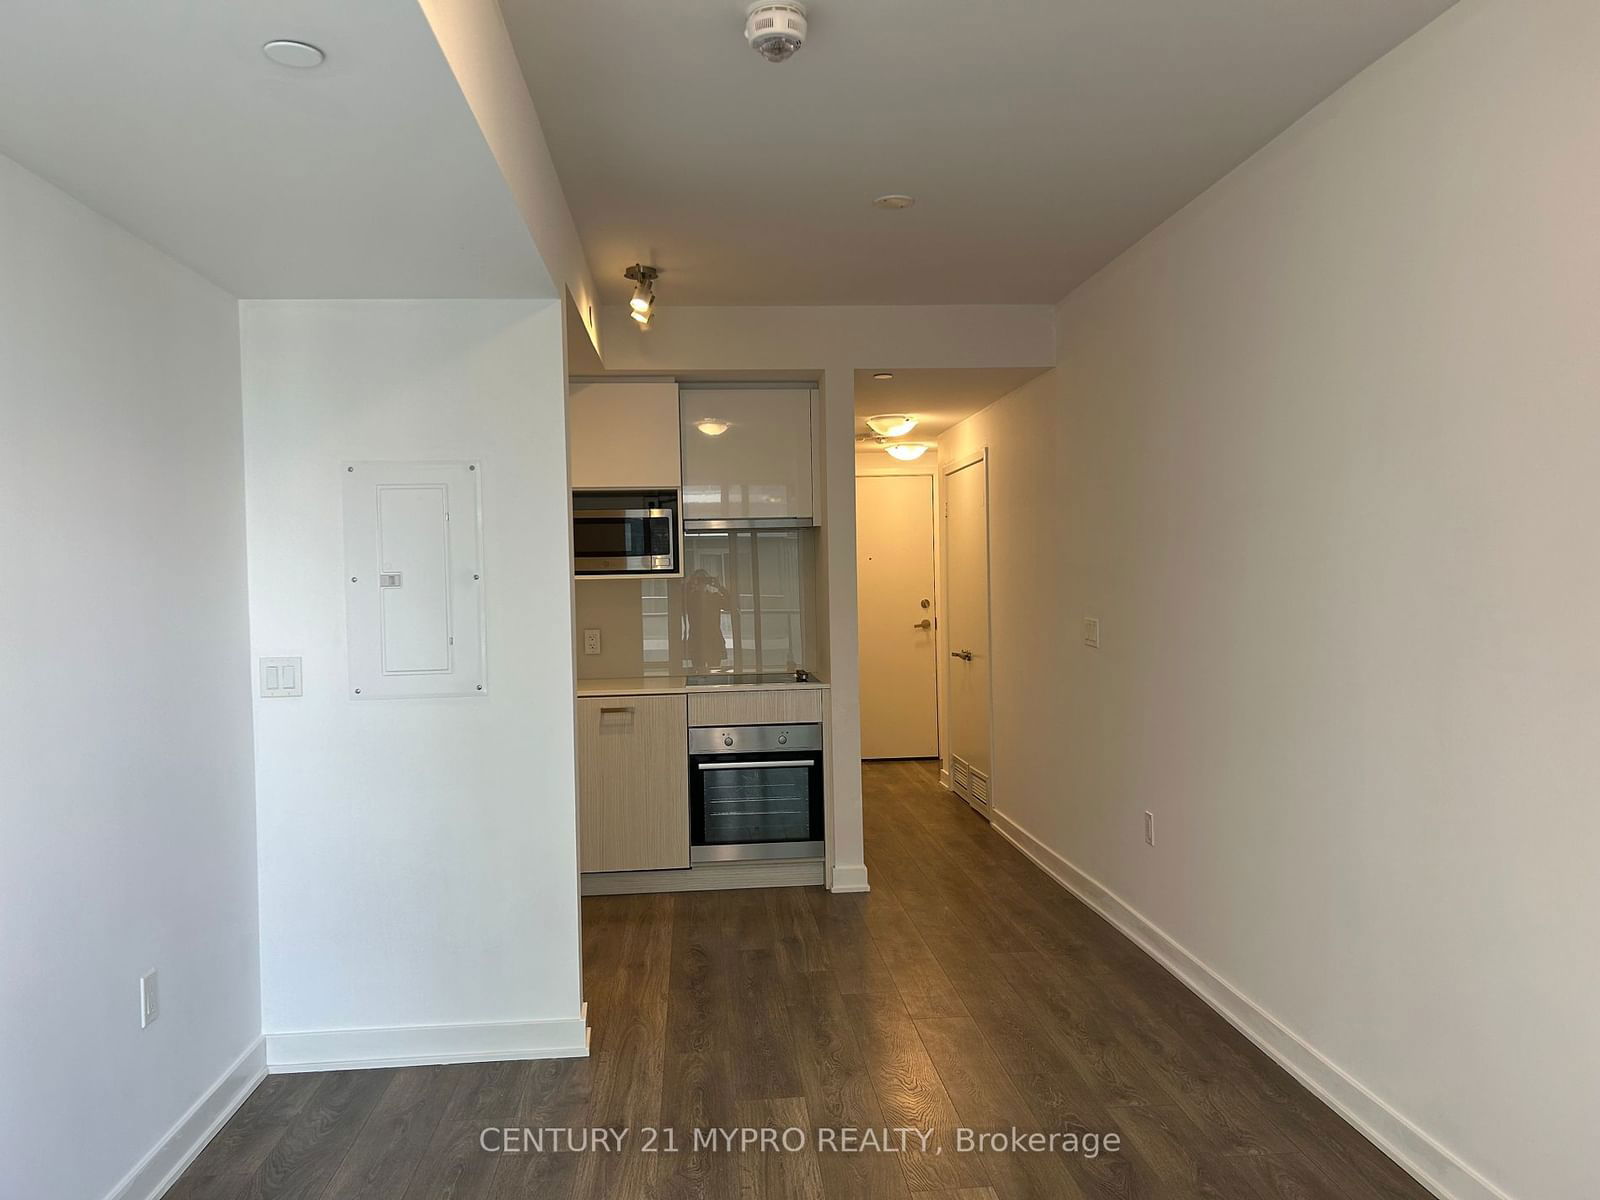
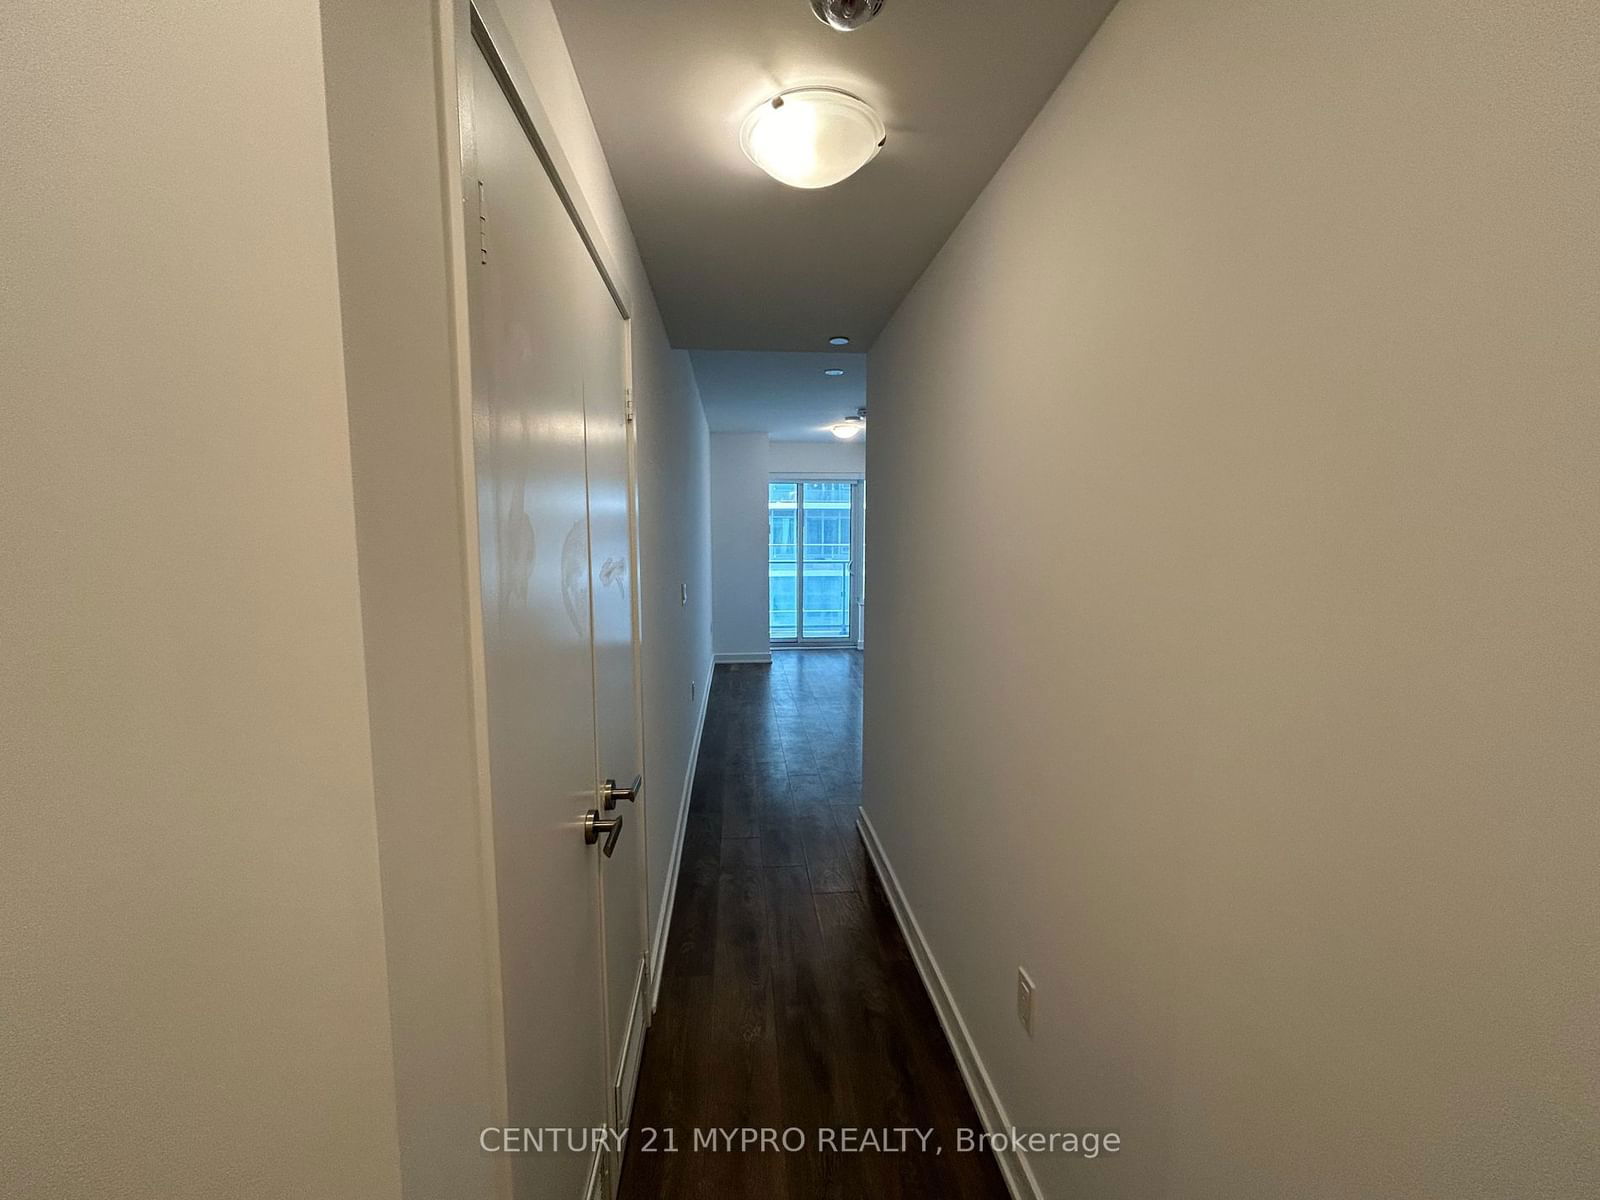
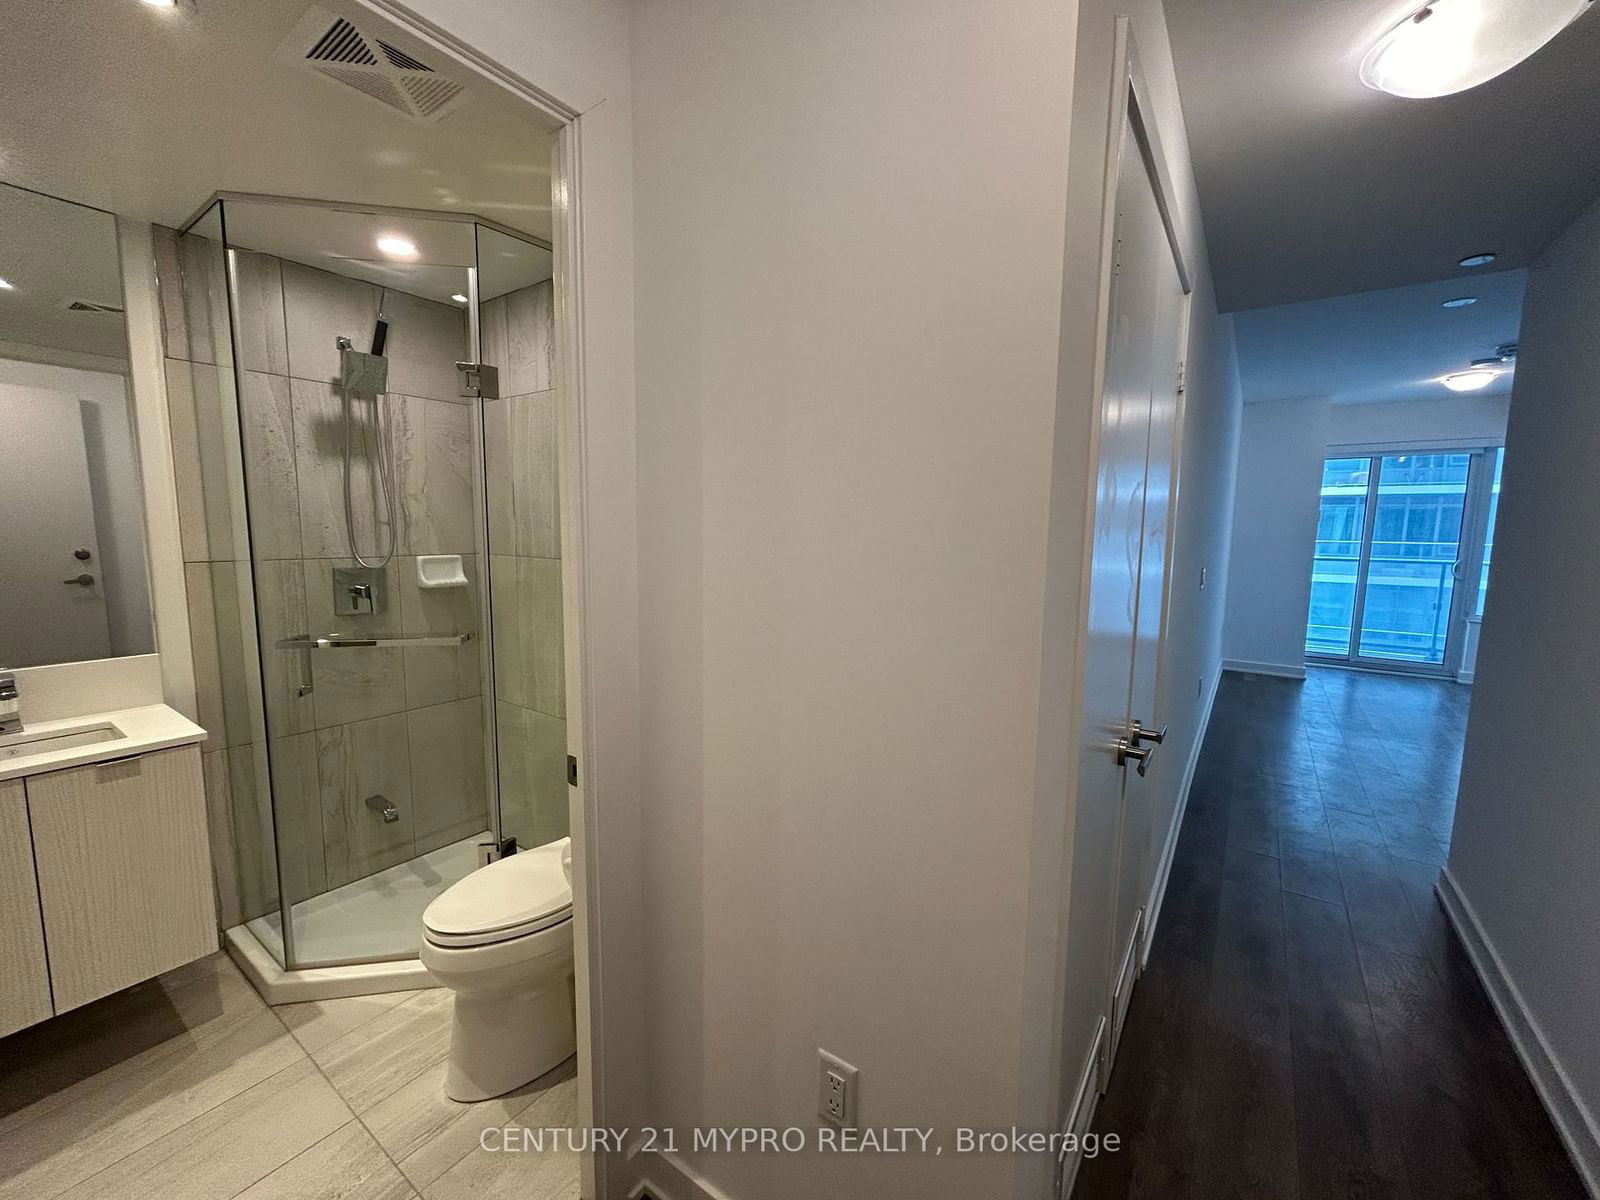
Welcome to Yonge and Eglinton, the centre of the City and transit hub! This beautifully designed building with it's large windows, sleek finishes and amazing amenities is a great place for a young student or professional to relax after a long day of work or refresh before stepping out to all the amazing restaurants, shops, parks, or a quick subway ride out. Boasting over 18,000Sf Indoor & Over10,000Sf Outdoor Amenities Including 2 Pools, Amphitheater, Party Rm W/ Chef's Kitchen, Fitness Centre. Pictures before current tenant.
century 21 mypro realtyMLS® #C11968534
Fees & Utilities
Utilities Included
Utility Type
Air Conditioning
Heat Source
Heating
Room dimensions are not available for this listing.
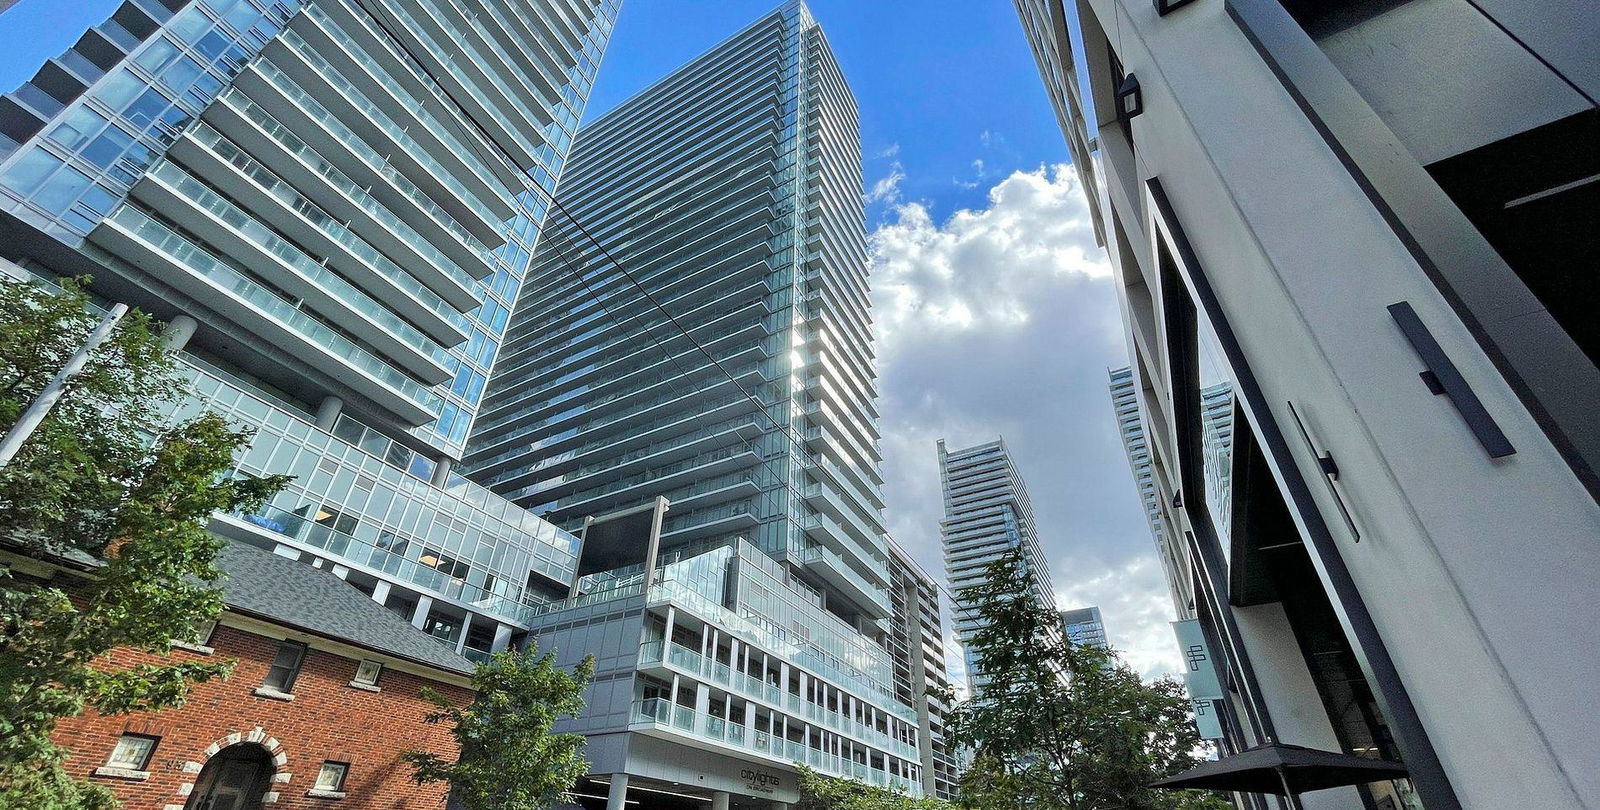
Building Spotlight
Similar Listings
Explore Mount Pleasant West
Commute Calculator

Demographics
Based on the dissemination area as defined by Statistics Canada. A dissemination area contains, on average, approximately 200 – 400 households.
Building Trends At CityLights on Broadway
Days on Strata
List vs Selling Price
Or in other words, the
Offer Competition
Turnover of Units
Property Value
Price Ranking
Sold Units
Rented Units
Best Value Rank
Appreciation Rank
Rental Yield
High Demand
Market Insights
Transaction Insights at CityLights on Broadway
| Studio | 1 Bed | 1 Bed + Den | 2 Bed | 2 Bed + Den | 3 Bed | 3 Bed + Den | |
|---|---|---|---|---|---|---|---|
| Price Range | $397,000 - $425,000 | $442,500 - $500,000 | $485,000 - $666,000 | $626,800 - $738,000 | No Data | No Data | No Data |
| Avg. Cost Per Sqft | $1,178 | $1,077 | $1,029 | $974 | No Data | No Data | No Data |
| Price Range | $1,650 - $2,050 | $1,800 - $2,500 | $1,900 - $2,950 | $1,400 - $3,500 | $3,250 - $4,000 | No Data | No Data |
| Avg. Wait for Unit Availability | 131 Days | 40 Days | 39 Days | 51 Days | 518 Days | No Data | No Data |
| Avg. Wait for Unit Availability | 15 Days | 4 Days | 5 Days | 5 Days | 120 Days | No Data | No Data |
| Ratio of Units in Building | 10% | 30% | 31% | 28% | 2% | 1% | 1% |
Market Inventory
Total number of units listed and leased in Mount Pleasant West
