3115 - 195 Redpath Ave


Listing History
Unit Highlights
Utilities Included
Utility Type
- Air Conditioning
- Central Air
- Heat Source
- Gas
- Heating
- Forced Air
Room Dimensions
About this Listing
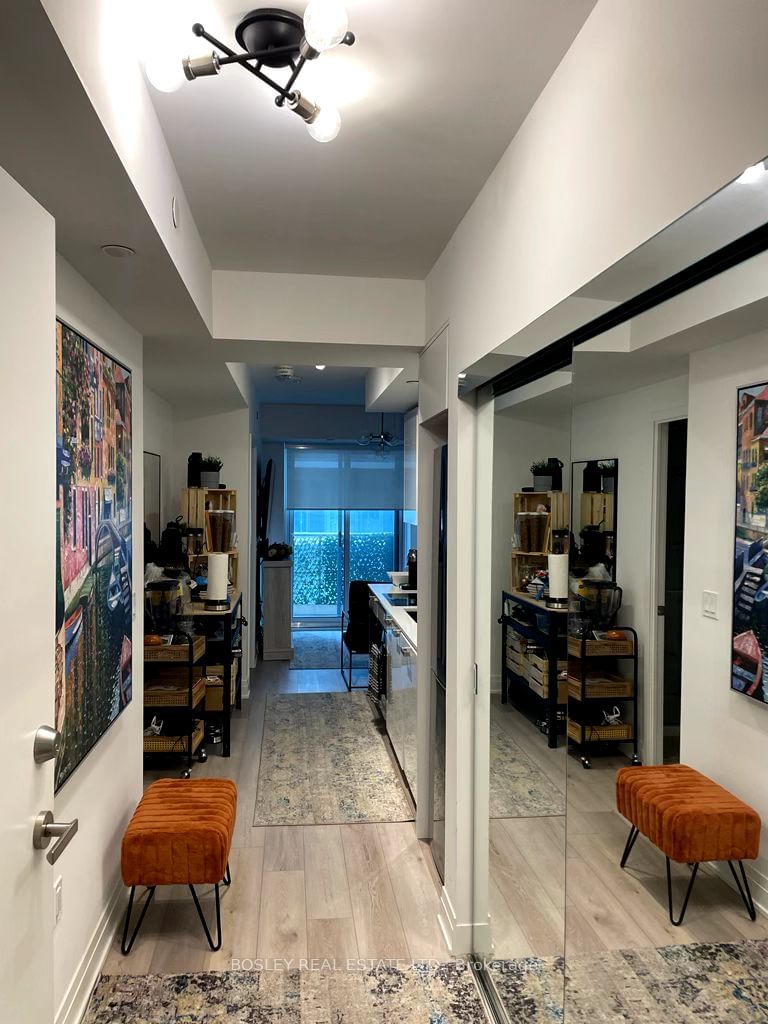
Beautifully Furnished, 'Upgrade Laden', executive rental in Fabulous Citylights on Broadway! Vibrant Mid Town Living in a unit you would be proud to call 'Home'. Wonderful building amenities, Walking distance to, well..Everything! Blackout Blind for bedroom sleep? Check! Closet organizers? Check! Mirrored sliding doors as you enter? Inviting, functional & creates feeling of space? Check! Custom Light Fixtures? Check! Thicker Underlay below flooring for comfort & noise insulation? Check! Pull out couch for occasional guests? Check! Unit comes with a Locker, Access to Fitness Centre, Pool, Party Room, Basketball court, Movie Theatre..Welcome Home! Could be unfurnished too!
ExtrasAll appliances included..furnished and move in ready! TENANT pays utilities. Can be had unfurnished.
bosley real estate ltd.MLS® #C9297915
Amenities
Explore Neighbourhood
Similar Listings
Demographics
Based on the dissemination area as defined by Statistics Canada. A dissemination area contains, on average, approximately 200 – 400 households.
Price Trends
Maintenance Fees
Building Trends At CityLights on Broadway
Days on Strata
List vs Selling Price
Offer Competition
Turnover of Units
Property Value
Price Ranking
Sold Units
Rented Units
Best Value Rank
Appreciation Rank
Rental Yield
High Demand
Transaction Insights at 99 Broadway Avenue
| Studio | 1 Bed | 1 Bed + Den | 2 Bed | 2 Bed + Den | 3 Bed | 3 Bed + Den | |
|---|---|---|---|---|---|---|---|
| Price Range | $397,000 - $430,000 | $458,000 - $531,000 | $485,000 - $690,000 | $626,800 - $900,000 | $925,000 | No Data | No Data |
| Avg. Cost Per Sqft | $1,148 | $1,149 | $1,092 | $1,041 | $691 | No Data | No Data |
| Price Range | $1,900 - $2,200 | $2,050 - $2,500 | $2,100 - $2,700 | $2,150 - $3,500 | $3,250 - $4,000 | No Data | No Data |
| Avg. Wait for Unit Availability | 124 Days | 46 Days | 45 Days | 51 Days | 518 Days | No Data | No Data |
| Avg. Wait for Unit Availability | 14 Days | 4 Days | 4 Days | 5 Days | 120 Days | No Data | No Data |
| Ratio of Units in Building | 10% | 29% | 31% | 29% | 2% | 1% | 1% |
Transactions vs Inventory
Total number of units listed and leased in Mount Pleasant East
